 Journal of Global Trade, Ethics and Law
“Prediction is very difficult, especially if it’s about the future”
- Nils Bohr
1. Introduction
“Prediction is very difficult, especially if it’s about the future.” These words are commonly attributed to Nils Bohr (1885-1962), the Danish physicist who, for his contributions to quantum theory, was awarded the Nobel Prize in Physics in 1922, one year after Einstein.
In the difficult task of forecasting the future - or, more precisely, of assigning probabilities to future events - prediction markets, also known as information markets or event markets, have increasingly attracted attention. Their archetype is the Iowa Electronic Market (IEM), an experimental market cited by Vernon Smith in his 2002 Nobel Prize Lecture:1
“What evidence do we have that the laboratory efficiency properties of continuous double auction trading apply also in the field? One of the best sources of evidence, I believe, is found in the Iowa Electronic Market (IEM) used widely around the world. (Forsythe, et al., 1991, 1999) These markets are used to study the efficacy of futures markets in aggregating widely dispersed information on the outcomes of political elections, or any well defined extra-laboratory event, such as a change in the discount rate by the FED. The ‘laboratory’ is the internet. The ‘subjects’ are all who log on and buy an initial portfolio of claims on the final event outcomes; they consist of whom ever logs in, and are not any kind of representative or ‘scientific’ sample as in the polls with which they are paired. The institution is the open book double auction.
In the IEM, traders make a market in shares representing pari-mutuel claims on the popular vote (or winner-take-all) outcome of an election, referendum, etc. For example the first IEM was on the 1988 Presidential Election. Each person wanting to trade shares deposits a minimum sum, $35, with the IEM and receives a trading account containing $10 cash for buying additional shares, and ten elemental portfolios at $2.50 each, consisting of one share of each of the candidates - Bush, Dukakis, Jackson, and ‘rest-offield.’ Trading occurs continuously in an open-book bid-ask market for several months, and everyone knows that the market will be called (trading suspended) in November on election day, when the dividend paid on each share is equal to the candidate’s fraction of the popular vote times $2.50. Hence if the final two candidates and all others receive popular vote shares (53.2%, 45.4%, 1.4%), these proportions (times $2.50) represent the payoff to a trader for each share held. Consequently, at any time t, normalizing on $1, the price of a share (÷$2.50), reflects the market expectation of that candidate’s share of the total vote. A price, $0.43 means the market predicts that the candidate will poll 43% of the vote. Other forms of contract that can be traded in some IEMs include winner-takeall, or number of seats in the House, and so on.
1 Smith (2002).
The IEM data set includes 49 markets, 41 worldwide elections and 13 countries. Several results stand out: the closing market prices, produced by a non-representative sample of traders, show lower average absolute forecasting error (1.5%) than the representative exit poll samples (1.9%); in the subset of 16 national elections, the market outperforms the polls in 9 of 15 cases; in the course of several months preceding the election outcome, the market predictions are consistently much less volatile than the polls; generally, larger and more active markets predict better than smaller, thinner markets; surveys of the market traders show that their share holdings are biased in favor of the candidates they themselves prefer.
In view of this last result why do markets outperform the polls? Forsythe, et al. (1991) argue that it’s their marginal trader hypothesis. Those who are active in price ‘setting,’ that is, in entering limit bids or asks, are found to be less subject to this bias, than those traders accepting (selling and buying ‘at market’) the limit bids and asks. Polls record unmotivated, representative, average opinion. Markets record motivated marginal opinion that cannot be described as ‘representative.’
For decades, researchers in artificial intelligence have attempted to construct intelligent systems by writing software that replicates human cognitive processes. More recently as the IEM clearly demonstrates - researchers have sought to solve complex problems by building networks of autonomous agents that interact with one another. The key idea behind intelligent system design increasingly appears to be that of leveraging individual agents - connected through information systems - and exploiting their cognitive capabilities in innovative ways.
Issues of public interest can therefore be addressed through mechanisms analogous to those used in markets for financial securities. The proposed solution is to create markets in which both correct and incorrect answers carry economic consequences. The underlying hypothesis is that such markets will amplify the influence of those who are in the best position to know the correct answer. Moreover, the very existence of these markets may induce participants to seek out information that improves the quality of their decisions.
The reason this approach should work is that less informed participants tend to lose money and are eventually driven out of the market, while better informed participants tend to profit and increasingly guide the market, thereby determining prices.
2. Review of Markets and Contract Design
The most widely known prediction market is the Iowa Electronic Market (IEM), established in 1988. The first contract traded on the IEM paid 2.5 cents for each percentage point of the popular vote received by each candidate in U.S. presidential elections (Bush, Dukakis, and others).
Universities in other countries have also begun to operate their own event markets.2 Examples include the Austrian Electronic Market at the Vienna University of Technology and the Election Stock Market at the University of British Columbia.
There are also prediction markets operated by firms active in the sports betting industry. 3 Notable examples include Trade-Sports, Betfair, and the World Sports Exchange.
According to information published on the Trade-Sports website (August 2005), the platform - managed by an Irish company whose financial statements were audited by Deloitte - reported cumulative trading volume of approximately $1 billion, around 70 million contracts traded, and more than 30,000 registered users over roughly three years of operation.
In some cases (e.g., Newsfutures or the Hollywood Stock Exchange), trading takes place using virtual currency. These exchanges define the contracts, and participants either submit their own offers or accept those posted by others. On the Newsfutures platform founded in 2000 and active until 2004 - participants could speculate on a wide range of current events, including politics, sports, cinema, economics, and technology. As an incentive, prizes were awarded to the top performing participants. Participants in the Hollywood Stock Exchange use virtual currency to speculate on questions related to the film industry, such as a movie’s box-office revenue, the number of spectators during its opening weekend, or the allocation of Academy Awards. Insider trading is entirely legal in this market and is, in fact, explicitly encouraged. Film studios often rely on the forecasts generated by these markets.
The Foresight Exchange also operates using virtual currency. The range of contracts offered is broad, spanning traditional financial contracts as well as contracts related to disasters, news events, politics, and scientific developments. For example, at the end of August 2005, the contract “NASDAQ drops below 1000 by 2008” traded at 24, “Whites US Minority by 2060” at 75, “Cold Fusion by 2015” at 19, “Human Organ Farms by 2015” at 26, and “Moonbase by 2025” at 35.
More recently (in 2002), Goldman Sachs and Deutsche Bank launched a new market -Economic Derivatives - in which the events to be predicted concern the release of macroeconomic data, such as employment, retail sales, gross domestic product, consumer confidence indices, and inflation.
In June 2005, Goldman Sachs reached an agreement with the Chicago Mercantile Exchange to create the CME Auction Markets, where “a series of innovative event-driven economic derivatives” would be traded. The auctions were to be conducted using proprietary software developed by Longitude. The agreement specified that trading would initially take place via the web starting in September 2005, before migrating to the Globex platform in January 2006.
This CME initiative illustrates how the phenomenon of prediction markets - initially confined to over-the-counter markets - began, at that time, to extend into organized exchange-traded markets.4
2 See Brüggelambert (1988), Ortner (1996), Beckmann, & Werding (1996), Jacobsen et al. (2000). 3 See Wolfers & Leigh (2001). 4 For a survey, see Goldfinger (2004).
A list of existing prediction markets is provided in Errore. L'origine riferimento non è stata trovata., while a sample of contracts traded on the Foresight Exchange is reported in Errore. L'origine riferimento non è stata trovata..
3. Iowa Electronic Markets
The Iowa Electronic Markets (IEM) are small-scale markets - managed by the College of Business at the University of Iowa - in which contracts are traded using real money.5 The most prominent of these markets are the Iowa Political Markets.6 Contracts traded in these markets are designed so that prices can be used to generate forecasts of electoral outcomes.7
The IEM operate continuously, 24 hours a day, and employ a continuous doubleauction trading mechanism. Traders invest their own funds, execute trades autonomously, and gather information independently. As such, the IEM occupy a niche between highly stylized and tightly controlled “laboratory” markets and fully fledged “real” markets. Owing to their design, the IEM provide researchers with data that are otherwise unavailable.
In the IEM, data collection and aggregation rely on a mechanism that differs substantially from that used in opinion polls. Polls are based on representative samples of potential voters, the reliability of survey responses, and statistical inference. In contrast, IEM traders face explicit monetary incentives and do not constitute a representative sample of the electorate. The vast majority of participants are young (with an average age close to 30), predominantly male, and well educated. Traders are not required to satisfy the eligibility criteria for voting in elections.
3.1. Market Mechanism
Each market is linked to a specific future event - such as a presidential election - and allows the trading of contracts whose final value (payoff) is determined by the outcome of that event. Contracts enter circulation when traders purchase a bundle of contracts from the exchange, known as unit portfolios. Conversely, contracts are withdrawn from circulation when unit portfolios are sold back to the exchange.
5 The maximum investment allowed per trader is $500. Average investment is less than $50. The number of traders actively participating in a given market typically ranges from a dozen to more than 500. In the market on the 1992 U.S. presidential elections, 78,007 contracts were traded, for a total notional value of $21,445.
6 The Iowa Electronic Markets are composed of several segments: electoral markets based on vote shares (vote-share markets), markets based on the number of seats (seat-share markets), and markets based on the election winner (winner-takes-all markets), as well as markets based on other political outcomes, economic indicators, corporate earnings, and rates of return of selected firms.
7 The information is drawn from Berg, Forsythe, Nelson, and Rietz (1998).
Unit portfolios consist of one unit of each contract available in the market. They are purchased from and sold to the exchange at a fixed price equal to the final value of the entire portfolio. The rate of return associated with a unit portfolio is equal to the risk-free interest rate, which is zero in the case of the IEM.
The use of unit portfolios ensures that the market operates as a zero-sum game and that the supply of contracts is determined endogenously by the net number of unit portfolios purchased by traders. Unit portfolios serve solely to introduce contracts into circulation. Transactions among traders take place at prices determined by participants for each individual contract.
Traders may submit market orders, which require immediate execution at the prevailing market price, or limit orders, which specify quantities to buy or sell at given bid or ask prices within a specified time horizon. Limit orders are ranked according to price and the time at which they are submitted. They may be canceled at any time before being executed (hit) or before expiration.
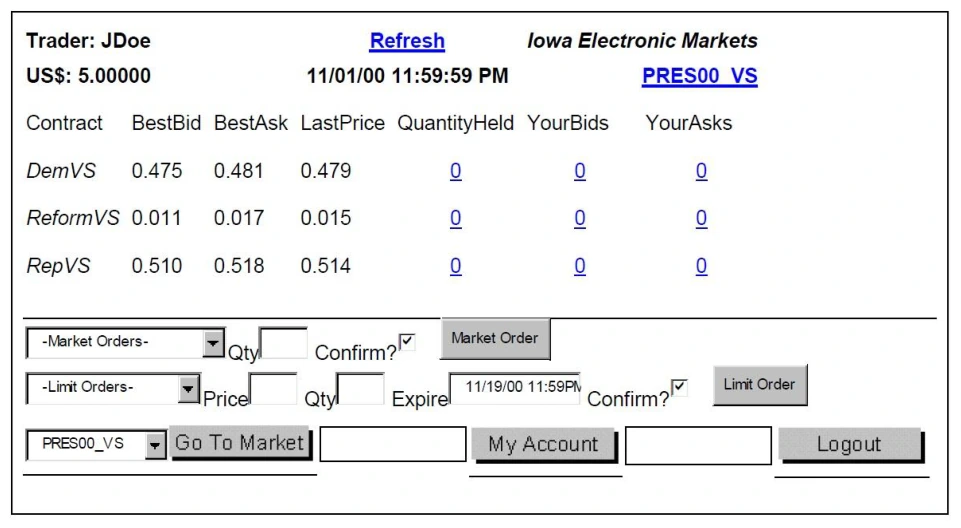
Note: The trading screen is divided into three sections. The upper section reports - for each contract (e.g., DemVS, ReformVS, and RepVS) - the best bid and ask quotes, the price of the most recent transaction (last trade price), the trader’s current holdings (quantity held), and the trader’s outstanding buy (YourBids) and sell (YourAsks) orders. The middle section contains a menu that allows traders to enter quantities (Qty) for market orders or limit orders, specifying, in the latter case, both the price (Price) and the expiration date (Expire). The lower section provides a menu enabling traders to access other activities.
The information set made available by the exchange to traders consists of the most recent transaction price (last trade price) and the best bid and ask quotes. The screen that appears to traders is shown in Errore. L'origine riferimento non è stata trovata..
Traders do not observe the quantities available at the best bid and ask prices, nor do they have access to the remainder of the order book, which comprises all outstanding limit orders. With respect to historical data, traders may access daily information on trading volume and contract value, as well as daily minimum, maximum, average, and closing prices.8
3.2. Types of Markets
Winner-Takes-All Markets Contracts traded in winner-takes-all markets pay $1 if the associated event occurs. For example, if an election is won by a given candidate, the contract linked to that candidate yields a payoff of $1.
Vote-Share Markets In vote-share markets, the final value of each contract is determined by the share of votes received by the corresponding candidate. The final value of a contract equals the product of $1 and the candidate’s vote share. To ensure that the sum of vote shares equals unity, one of two methods is employed:
- A contract associated with the residual vote share (rest-of-the-field contract) is traded; or 2. Vote shares are computed as fractions of a restricted total (for example, the Democratic vote share is calculated as the number of votes received by the Democratic candidate divided by the total votes received by Democratic and Republican candidates). The method adopted in each case is described in the prospectus prepared for the specific market.
8 Although markets operate continuously, information is aggregated and reported over daily 24-hour periods.
Seat-Share Markets In seat-share markets, the final value of contracts is determined by the number of legislative seats obtained by each party in an election. The payoff of each contract equals the product of $1 and the party’s share of seats.
3.3. Efficiency
A recurring question in the analysis of these new markets concerns their efficiency. Are prediction markets truly efficient? Do they effectively aggregate information? What is the informational content of market prices? Are the prices generated in these markets genuinely useful for forecasting purposes? According to several empirical studies, the answer appears to be affirmative.
Berg et al. (2000) argue that prices observed in the Iowa Electronic Market yield highly accurate forecasts, outperforming those derived from opinion polls.9
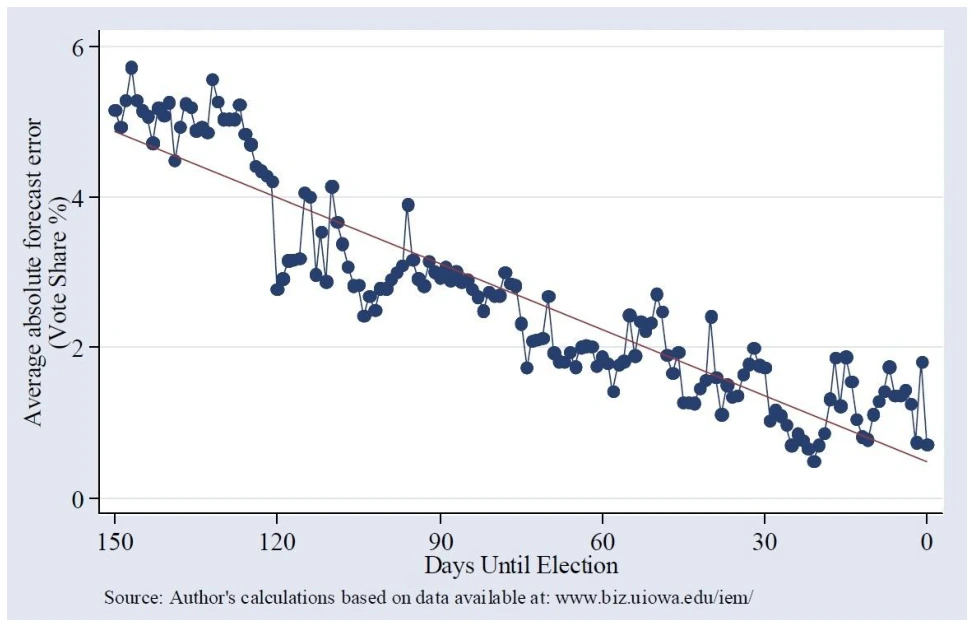
Errore. L'origine riferimento non è stata trovata. reports data for four U.S. presidential elections (1988-2000). The horizontal axis shows the number of days remaining until election day, while the vertical axis reports the mean absolute forecasting error computed on the basis of IEM prices. As the figure shows, the accuracy of marketbased forecasts improves as election day approaches, in parallel with the arrival of new information. Errore. L'origine riferimento non è stata trovata. also indicates that, during the final week before the election, markets predicted the vote shares of Democratic and Republican candidates with an average absolute error of approximately 1.5 percentage points. By comparison, the forecasting error of the final Gallup polls for the same four elections was 2.1 percentage points (Errore. L'origine riferimento non è
9 See also Granberg & Brent (1983), Oliven & Rietz (1995), Bondarenko & Bossaerts (1999), Slemrod & Greimel (1999).

3.3.1. Bush vs. Kerry
It should be noted that the sum of the average prices of the two contracts (column “Average”) equals 1 (= 0.508 + 0.492). This is not the case for closing prices (column “Last”), which may reflect slight timing mismatches. A graphical representation of the “Last” prices is provided in Figure 1.

In the second market (Pres04_WTA), four contracts were traded: DEM04_G52 and DEM04_L52 (Kerry receiving more or less than 52% of the vote), and REP04_G52 and REP04_L52 (Bush receiving more or less than 52% of the vote). The quoted prices were as follows:
Symbol Units Volume ($) Low High Average Last
DEM04_G52 9,227 1,358,635 0.130 0.164 0.147 0.155
DEM04_L52 10,365 3,606,583 0.300 0.474 0.348 0.330
REP04_G52 13,069 2,067,415 0.070 0.239 0.158 0.150
REP04_L52 11,609 3,978,678 0.309 0.393 0.343 0.362
By summing the “Average” prices of the first two contracts, one obtains the marketimplied probability of a Kerry victory: 49.5% (= 14.7% + 34.8%). Summing the “Average” prices of the last two contracts yields the probability of a Bush victory: 50.3% (= 15.8% + 34.3%). The resulting values do not sum to one and are marginally different from those obtained previously. This inconsistency would likely not have arisen had midmarket prices - that is, the averages of bid and ask quotes - been used; however, historical series of such prices are not available on the IEM website.
3.3.2. Vote-Share and Seat-Share Markets
In
Figure 2, electoral forecasts based on 237 contracts (49 markets across 13 countries) are compared with actual election outcomes. In the figure, the horizontal axis measures actual outcomes, while the vertical axis reports predicted outcomes. If forecasts were perfectly accurate, all points would lie on the 45-degree line. Forecasts that overestimate outcomes appear above the line, while underestimates appear below it.
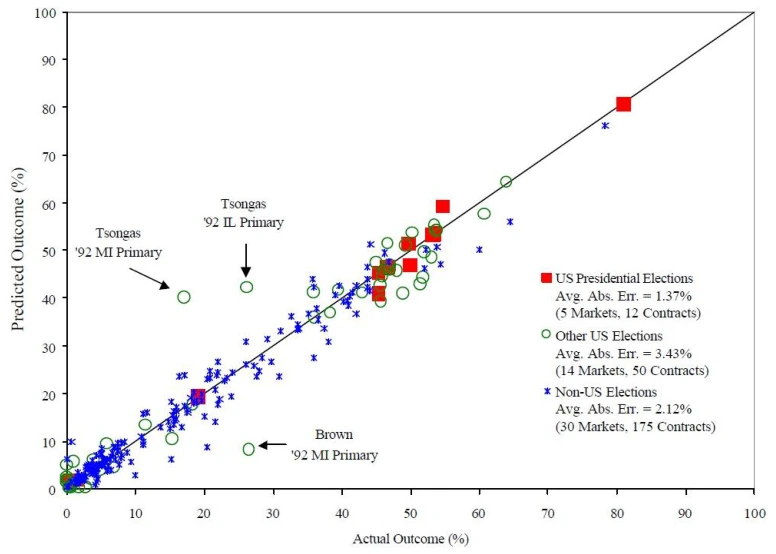
Note: VOTE-SHARE MARKETS: Austria (Federal Parliamentary Elections ’95; Styria ’95; Vienna ’95; European Parliamentary Elections ’96), Canada (Parliamentary Elections ’93, ’96), Korea (Presidential Election ’92), Denmark (Parliamentary Election ’91), Finland (Presidential Elections × 2 markets), France (Presidential Election ’95), Germany (Parliamentary Elections ’90 × 3 markets - Bonn, Frankfurt, and Leipzig; Federal Elections ’91, ’94, and ’98; State Election
’98), Norway (Parliamentary Election ’95), Netherlands (Parliamentary Elections ’91, ’94 - Second Chamber; European
Parliamentary Election ’94; Municipal Council Election ’94), Sweden (European Parliamentary Election ’94), Turkey
(Parliamentary Election ’91), United States - Gubernatorial Elections (NY ’94, TX ’94), United States - House of Representatives (UT ’94), United States - Presidential Elections (’88, ’92, ’96 × 2 markets, ’00), United States - Presidential
Primaries (IL ’92, MI ’92), United States - Senate Elections (IL ’90, IA ’90, AZ ’94, NJ ’94, PA ’94, TX ’94, VA ’94). SEAT-SHARE MARKETS AND OTHERS: Australia (Parliamentary Election ’93), Canada (Parliamentary Elections ’93, ’96), Netherlands (Parliamentary Election ’94 - Second Chamber; European Parliamentary Election ’94), United States -
House of Representatives (’94), United States - Senate (’94).
Figure 2 shows no significant forecasting errors. On average - particularly in markets related to major U.S. elections - forecast accuracy is very high.
The variability in forecasting accuracy across U.S. elections can be explained by three main factors:
- markets associated with presidential elections perform better than markets associated with lower-profile elections at the congressional, state, or local level; 2. markets with higher trading volume close to election day perform better than those with lower trading volume; 3. markets with a smaller number of contracts (i.e., fewer candidates or parties) perform better than those with a larger number of contracts.
3.3.3. Opinion Polls
Figure 3 compares the relative performance of prediction markets and opinion polls. Because market prices change continuously, a choice must be made regarding which price should be used for forecasting purposes.
Figure 3: Presidential Elections (Vote-Share Markets): Forecasting Errors (Polls and Markets).
Source: Berg et al. (2000).
Note: The forecasts derived from the major opinion polls conducted during the week preceding the presidential elections are
compared with those generated by the vote-share markets over the same week and at midnight on the day preceding the
election.
Two measures are reported in Figure 3:
- the price observed at midnight on the day preceding the election; and (ii) the average price (weighted by trading volume) observed during the week preceding the election.
The first measure incorporates all information available to traders as of midnight on the day before the election, but it is subject to high variability due to the thinning of the order book on the final trading day.
The second measure reflects trades occurring contemporaneously with major opinion polls.
Market performance - measured using both pricing methods - was superior to that of opinion polls in 9 out of 15 cases. The mean absolute forecasting error of opinion polls was 1.93 percent, while that of markets was 1.49 percent using the first measure and 1.58 percent using the second.
In some cases - specifically, the U.S. presidential elections of 1988 and 1992 - the performance of prediction markets was clearly superior to that of opinion polls. In most other cases, markets performed approximately on par with polls, sometimes slightly worse but more often slightly better.
3.4. Educational Uses
The IEM have been used to study a wide range of issues. They help bridge the gap between traditional laboratory markets and real-world markets and provide information not typically available in financial markets, including individual traders’ orders, detailed transaction data, complete order-book information, portfolio compositions of individual traders, and demographic characteristics of participants.
The IEM also allow researchers to interview traders at any point in time, record their responses, and link those responses to other available information, thereby complementing existing research methodologies.
4. Trade-Sports
4.1. Elections
Prediction markets allow researchers to assess the relative popularity of potential candidates in elections. In this respect, contracts on prospective Democratic and Republican candidates for the 2008 U.S. presidential election traded on Trade-Sports are particularly informative. For example, at the end of August 2005, the contract on Hillary Clinton traded in the range of 41.5-41.9 (Figure 4), significantly outperforming other potential candidates.

4.1.1. Arnold Schwarzenegger
Figure 5 reports bid and ask quotes recorded at four-hour intervals on two markets –Trade-Sports and the World Sports Exchange – both of which traded a contract on the election of Arnold Schwarzenegger as Governor of California. Opportunities for risk-free arbitrage, achieved by purchasing the contract at a lower ask price on one market and selling it at a higher bid price on the other, were virtually nonexistent.

4.2. Current Events
4.2.1. Saddam Hussein
An example of contracts linked to current events is provided by the so-called Saddam securities. These contracts, traded on Trade-Sports, paid a payoff of $100 if Saddam Hussein were removed from power by the end of June 2003.
Figure 6 shows that the price of these securities moved closely in line with two other indicators: the “Saddameter”, developed by journalist William Saletan (Slate.com) to measure the perceived probability of a U.S. war with Iraq, and the price of oil, an obvious barometer of geopolitical tension in the Middle East.

On March 19, 2003, U.S. President George W. Bush announced the beginning of the military campaign against Iraq. On April 5, U.S. forces entered Baghdad, and on May 1 - 43 days after the start of the war - Bush announced that “major combat operations in Iraq have ended.” As shown in Figure 6, the Saddameter rose to levels close to 100 already at the beginning of March, while the probability of Saddam Hussein’s removal by June exceeded 90 percent immediately after the start of the military campaign.
4.2.2. Bin Laden / Al-Zarqawi
Contracts similar to those written on Saddam Hussein were subsequently traded on Osama Bin Laden and Abu Mus’ab Al-Zarqawi (Figure 7). At the end of February 2005, the higher prices of contracts linked to Al-Zarqawi relative to those linked to Bin Laden indicated that the market assigned a relatively low probability to the capture of either individual by June 2005.

4.2.3. Weapons of Mass Destruction in Iraq
In some cases, an entire family of contracts written on the same underlying event but with different maturities is traded. This is the case for contracts linked to the discovery of weapons of mass destruction in Iraq. Figure 8 shows prices for four contracts traded on Trade-Sports, with maturities in May, June, July, and September 2003. Prices moved closely together, reflecting the diffusion of a common stream of information, and converged to zero as maturity approached.

4.2.4. Olympic Games
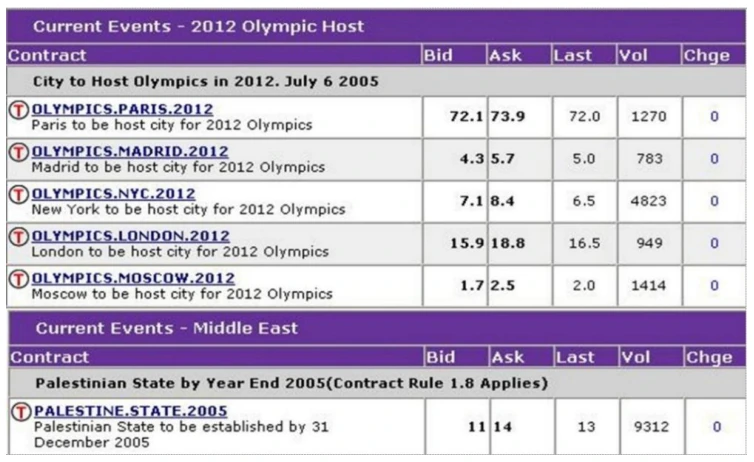
Contracts have also been traded on the selection of host cities for major international events, such as the 2012 Olympic Games. On February 25, 2005 - several months before the decision by the International Olympic Committee (July 6, 2005) - Trade-Sports prices favored Paris over London, which ultimately won the bid (Figure 9).
4.2.5. Palestinian State
On the same date (February 25, 2005), the contract linked to the establishment of a Palestinian state by the end of 2005 traded in the range of 11-13 (Figure 9). By August 30, 2005, the same contract traded at 5.0-5.1.
4.3. Federal Reserve
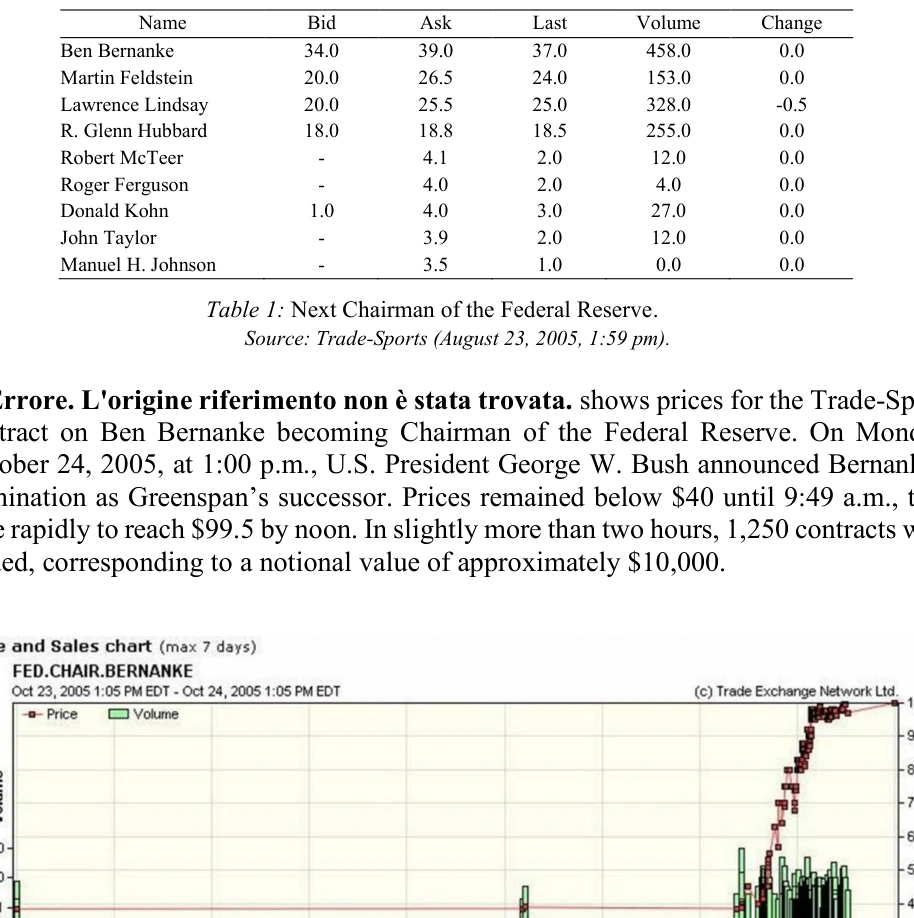
Prediction markets also provide a useful alternative to opinion polls in the context of appointments to high-level positions in institutions of international relevance. Table 1 reports prices for contracts linked to potential successors to Alan Greenspan as Chairman of the Federal Reserve, effective from January 2006.

4.4. Weather
4.4.1. Hurricane Activity
Trade-Sports also traded contracts linked to Hurricane Katrina. Five contracts were listed, paying $1 if the hurricane’s intensity - measured on a scale from 0 to 5 - reached level 3 or higher upon impact in Louisiana (LA), Mississippi (MS), Alabama (AL), Florida (FL), or in none of these locations. From late morning on August 28 through the morning of the following day, prices rose steadily from above $70 to $100.
5. Hollywood Stock Exchange
The Hollywood Stock Exchange (HSX), founded in 1996, is a subsidiary of Cantor Index Holdings, which is part of the Cantor Fitzgerald group. Among the contracts traded on the HSX are movie stocks, star bonds, movie options, and award options.
Prices of movie stocks reflect market expectations regarding box-office revenues during the first four weeks of theatrical release. For example, a quoted price of 75 (expressed in Hollywood dollars, H$) corresponds to expected box-office revenues of $75 million.
Trading in movie stocks begins when a film’s “shares” are offered to the public through an Initial Public Offering (IPO), typically several months before the film is released. For instance, trading in the film Vanilla Sky (ticker symbol VNILA) began on July 26, 2000, at a price of H$11. Upon registration, each trader receives an initial endowment of H$2 million and may hold no more than 50,000 shares of any single film. Trading activity generally peaks in the days preceding a film’s release. In the case of Vanilla Sky, approximately 22 million shares were traded on the day prior to its release.
Trading is halted on the day the film opens in theaters, in order to prevent unfair advantages for participants who might have access to box-office data before such information becomes public. Consequently, the halt price - the final price observed prior to the trading halt - represents a point estimate of the film’s expected success before release.
For Vanilla Sky, the halt price was H$59.71 (Errore. L'origine riferimento non è stata trovata.). Trading resumes immediately after the opening weekend. The reopening price is determined on the basis of actual box-office revenues, using a conversion factor. When a film opens on a Friday, opening-weekend box-office revenues (in millions of dollars) are multiplied by 2.9 to compute the adjusted price (adjust price). This multiplicative factor is based on the assumption that total box-office revenues during the first four weeks of release amount to 2.9 times the revenues earned during the opening weekend. In the case of Vanilla Sky, opening-weekend revenues were approximately $25 million, implying an adjusted price of H$72.5 (= $25 × 2.9). Movie stocks are delisted after four weeks of theatrical release, at which point the delist price is calculated. For Vanilla Sky, which was delisted on January 7, 2002, the delist price was H$81.1, reflecting total box-office revenues of $81.1 million during the first four weeks.

Star bonds represent actors and directors. Prices of star bonds reflect both the boxoffice performance of the films in which they appear - measured by the Trailing Average Gross (TAG) - and their future potential, as assessed by HSX traders. If an actor or director ends his or her career (due to death, retirement, or other reasons), the nominal value at which the corresponding star bonds are redeemed equals the TAG. The TAG measures a star’s average box-office performance based on the five most recent films. Bond prices are adjusted whenever one of the films exits the market.
Movie options, both calls and puts, are written on a film’s box-office performance during its opening weekend. For example, an H$15 call option on the film Jillian in June has a strike price of H$15 and pays the maximum of zero and the difference between the film’s actual opening-weekend box-office revenues and $15 million.
Award options, associated with the Annual Academy Awards (Oscars), have final payoffs equal to either H$0 or H$25. Five options are traded - one for each nominee - in each of the eight major award categories: Best Picture, Best Actor, Best Actress, Best Supporting Actor, Best Supporting Actress, Best Director, Best Original Screenplay, and Best Adapted Screenplay.
Forecasts generated by the Hollywood Stock Exchange regarding box-office performance have proven to be highly accurate, as shown in Figure 12.10 Market prices have also been used to evaluate the effectiveness of advertising campaigns. The HSX has likewise demonstrated considerable accuracy in predicting Oscar winners.
10 See also Pennock et al (2001).

6. Economic Derivatives
Economic derivatives are derivatives whose payoffs depend on the release of macroeconomic data. For example, options written on nonfarm payrolls are settled when the employment report is released and the corresponding payroll figure becomes public.
The most common instruments traded in these markets are digital (binary) options. A digital call (put) pays $1 if the macroeconomic outcome exceeds (falls below) the strike. Typically, between 10 and 20 options - of both call and put types - are traded, each with a different strike price. In addition to digital options, digital ranges are also traded; these pay $1 if the macroeconomic outcome lies within a specified interval (range) bounded by two strike prices. Other contracts traded in this market - such as capped vanilla options or forwards - are simple portfolios of digital ranges.
Figure 13 reports prices of digital ranges written on the monthly rate of change in retail sales, observed during the auction held on May 12, 2005 (conducted shortly before the official retail sales data were released).

The Economic Derivatives market operated by Goldman Sachs, Deutsche Bank, and ICAP is distinguished by its specific market design, which is based on proprietary software developed by Longitude, a firm headquartered in New Jersey. Whereas most prediction markets rely on a continuous double-auction mechanism, the economic derivatives market is organized around a discrete sequence of auctions, with the objective of maximizing liquidity.
Each individual auction is conducted using a mutualistic system (pari-mutuel system), similar to the totalizator used in horse racing. The aggregate prize pool, net of a management fee, is distributed among the winning positions. The price at which participants enter the various contracts is not known at the time orders are submitted, but only once the auction closes. During the period preceding the auction’s close, only indicative prices are communicated; these coincide with actual transaction prices only if no further orders are submitted.
Market participants may submit limit orders. The Longitude software determines equilibrium prices that maximize traded quantities. As in uniform-price auctions, all contracts of the same type are executed at the same price, regardless of the individual limit prices specified by participants.
Prices reflect the relative demand for the different contracts. The auction mechanism always allows a price to be determined for each contract, even when there is trading interest on only one side of the market (i.e., when all participants wish to buy or all wish to sell). An instructive analogy can be drawn with horse racing: even if no one is willing to “sell” a particular horse, odds are nevertheless determined by the totalizator. Selling one horse is equivalent to buying all the others.
7. Policy Analysis Market
In July 2003, the press began reporting on a project promoted by the Defense Advanced Research Projects Agency (DARPA), an agency of the U.S. Department of Defense. The project aimed to establish a Policy Analysis Market (PAM) for trading contracts linked to geopolitical risks. The proposed contracts were based on indicators of economic wellbeing, civil stability, military capabilities, and measures of conflict, and - looking forward - also on specific discrete events.
For example, the design of these contracts sought to address questions such as: “At what rate will Egypt’s non-oil production grow next year?” or “Will the U.S. military withdraw from Country A within the next two years?” In addition, the exchange would have offered combinations of contracts, allowing economic and political events to be linked together. The underlying objective was to determine whether the existence of such markets could (i) facilitate the prediction of future events and (ii) help to clarify perceptions of the interconnections among different events.
The publication of press articles on the DARPA initiative was followed by a sharp political backlash. Several critics strongly attacked DARPA, accusing it of proposing “futures on terrorism.” Rather than committing its political capital to defending a relatively small project, DARPA ultimately chose to withdraw the proposal.
Ironically, in the aftermath of the DARPA controversy, prediction markets themselves provided a striking illustration of their ability to generate information about the probabilities of future events. Trade-Sports introduced a new contract that would pay $100 if the head of DARPA, Admiral John Poindexter, were removed from office by the end of August 2003. Early trading suggested that the probability of Poindexter’s dismissal by the end of August was approximately 40 percent. Price fluctuations closely tracked the evolution of news.
On July 31, around midday, the press began citing reliable Pentagon sources indicating that Poindexter’s resignation was imminent. Within minutes of the first newswire reports - and several hours before the information became widely disseminated - the contract price jumped from $40 to $80. News agencies did not specify the exact date of Poindexter’s resignation, which explains why prices did not immediately approach $100.
In early August, the price gradually declined toward $50. On August 12, Poindexter submitted a letter of resignation indicating that he would step down on August 29. On the same day, the contract price surged and reached a level of $96.
8. Subjective Probabilities and Risk-Neutral Probabilities
Mark Rubinstein (University of California at Berkeley) has emphasized the close correspondence between winner-takes-all markets and markets for state-contingent claims, which form the foundations of modern “core” financial economics. In particular, he has noted that the state-contingent price equals the present value of the product of the (discounted) subjective probability and a risk-adjustment factor:11
“The winner-takes-all market at the University of Iowa, an Internet-based market on U.S. presidential elections, immediately comes to mind as a concrete example. In 2000, participants could purchase at price PB a contract that would pay X=$1 if Bush were elected and $0 otherwise. Alternatively, they could purchase at price PG a contract that would pay X=$1 if Gore were elected and $0 otherwise. Ignoring the small probability of a third candidate winning and ignoring interest, the absence of arbitrage opportunities requires that the sum of prices satisfy PB+ PG=$1. In fact, this condition held. One is then naturally led to ask (in the spirit of Huygens): is PB the subjective probability that Bush will win, and is PG the subjective probability that Gore will win? No, this is not the case. For example, if a risk-averse individual expects economic conditions to be better under Bush than under Gore, the utility derived from receiving an additional dollar if Gore is elected will be greater than the utility derived from receiving an additional dollar if Bush is elected. Alternatively, it may be that an individual bets on Bush but would feel so disappointed if Bush were elected that he would be unable to enjoy the extra dollar in the same way as he would if he had bet on Gore and Gore had been elected. As a result, prices of contracts on Bush and Gore are influenced not only by subjective probabilities but also by the utilities associated with the respective events. In conclusion, the price PB of the contract on Bush will be slightly lower than the probability of a Bush victory, while PG will be correspondingly higher. Their sum will nevertheless equal $1.”
For further clarification, consider the following numerical example provided by Rubinstein.12 The case examined is that of an insurance policy against earthquake risk (Figure 14).
11 See Rubinstein (2005). See also Kahneman & Tversky (1979). 12 See Rubinstein (1999).

The payoff of the policy varies as a function of the damage incurred, which is correlated with earthquake intensity (measured on the Richter scale). The subjective probability that, over the next year, no earthquake occurs or that any earthquake is of negligible intensity (between 0 and 4.9 on the Richter scale) is equal to 85 percent. The remaining 15 percent probability is assigned to earthquakes of greater intensity: 10 percent to earthquakes of mild intensity (5.0-5.4), 3 percent to those of moderate intensity (5.5-5.9), 1.5 percent to those of medium intensity (6.0-6.9), and 0.5 percent to the most severe earthquakes (7.0-8.9).
Subjective probabilities must then be transformed into risk-neutral probabilities by multiplying them by appropriate coefficients reflecting risk aversion. The next step consists of multiplying the risk-neutral probabilities by the corresponding policy payoffs. This yields the expected values of the individual state-contingent claims - that is, the expected values of securities that pay off if, and only if, an earthquake of a given intensity occurs (mild, moderate, medium, or severe). Discounting these expected values at the one-year risk-free interest rate produces the state-contingent prices, i.e., the current prices of the state-contingent claims. Finally, the sum of the state-contingent prices yields the current value of the insurance policy.
9. Regulation
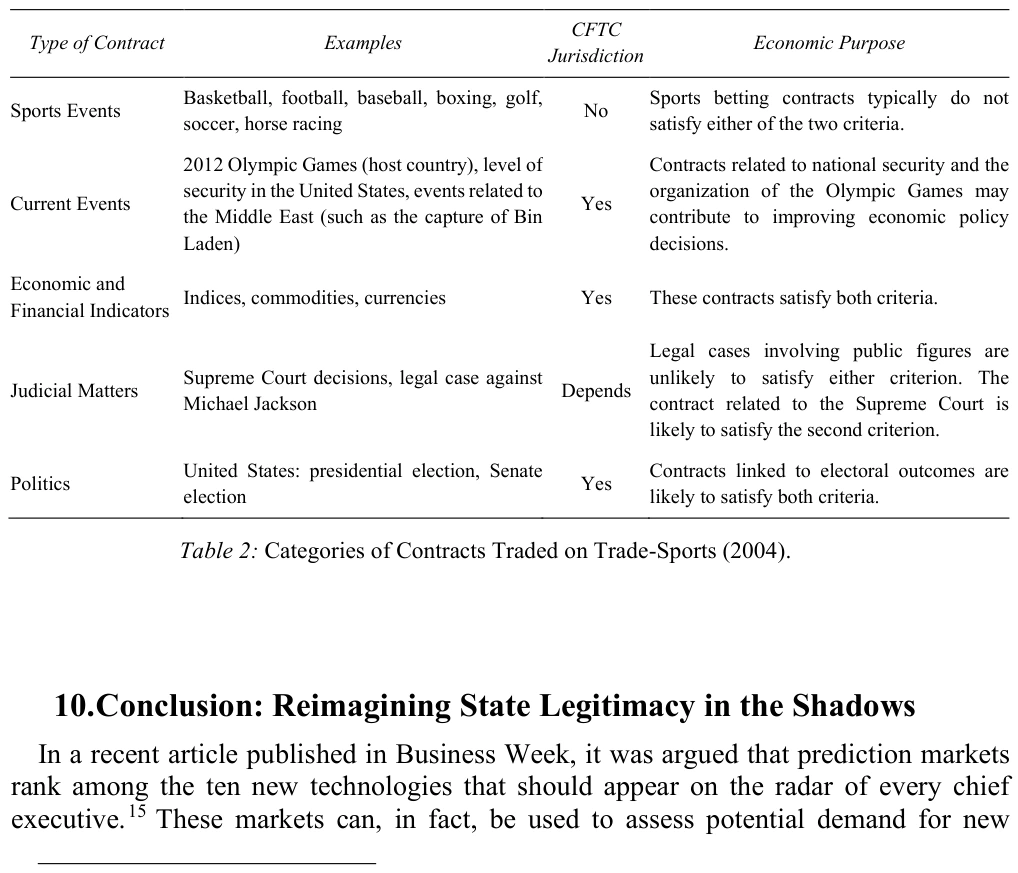
Prediction markets have been expanding, and their diffusion raises new regulatory challenges. The Commodities Futures Trading Commission (CFTC) - which in the past effectively authorized the Iowa Electronic Market through a no-action letter - has since been required to examine a growing number of applications for authorization.13 In a recent paper, two criteria for the regulatory admissibility of contracts traded on information markets were proposed:14
Criterion 1. The contract traded on the information market must be capable of offering significant opportunities for financial hedging. Criterion 2. Prices generated by contracts traded on the information market must be capable of providing relevant information that improves economic decision-making.
The authors of that paper subsequently attempted to assess whether contracts traded on Trade-Sports satisfy these two criteria. Their findings are reported in Table 2.
10. Conclusion: Reimagining State Legitimacy in the Shadows
In a recent article published in Business Week, it was argued that prediction markets rank among the ten new technologies that should appear on the radar of every chief executive.15 These markets can, in fact, be used to assess potential demand for new products, as illustrated by the case of the Hollywood Stock Exchange in the motion picture industry.
13 “On the other hand, if event markets were outside of the CFTC’s jurisdiction, then they would have to deal with 50 different state regulatory schemes. CFTC staff has been approached by several entities interested in becoming designated contract markets and listing event-type contracts, so resolving this issue has become a high priority.” See Gorham (2004).
14 See Hahn & Tetlock (2004). 15 See Kharif, Helm, and Lacy (2005).
More generally, prediction markets move in the direction envisioned by Arrow and Debreu, Nobel Prize laureates in economics, insofar as they offer new hedging opportunities for market participants and thereby enhance the efficiency of the economic system. From this perspective, prediction markets represent a valuable complement to derivatives markets.
Acknowledgement Heartfelt thanks to Paolo Savona and Massimiliano Talli for their helpful comments.
Funding No funding was received for conducting this study.
Conflicts of interest/Competing interests The author states that there is no conflict of interest. The funders had no role in the design of the study; in the collection, analyses, or interpretation of data; in the writing of the manuscript, or in the decision to publish the results.
Appendix A: Prediction markets
Market Events Austrian Electronic Markets http://www.imw.tuwien.ac.at/apsm/(Technische Universität Wien)
Elections
Financial Bets, Politics, Special Bets, Sports (American football, Australian rules, Baseball, Basketball, Boxing, Cricket, Cycling, Gaelic Games, Golf, Greyhound Racing, Horse Racing, Ice Hockey, Motor Sport, Poker, Rugby league, Rugby union, Soccer, Tennis)
Betfair www.betfair.com
Elections, Sports (American football, Australian rules, Baseball, Basketball, Boxing, Cricket, Darts, Football, Handball, Ice Hockey, Motor Racing, Rugby league, Rugby union, Speedway, Surfing, Tennis, Trotting, Greyhound racing, Harness racing, Horse racing) Economic Derivatives www.economicderivatives.com (Goldman Sachs, Deutsche Bank, ICAP)
Centrebet www.centrebet.com
Macroeconomic events (Nonfarm Payrolls, International Trade Balance, US GDP, ISM Manufacturing PMI, US Initial Jobless Claims, Retail Sales less Autos, Eurozone HICP)
Election Stock Market esm.ubc.ca (University of British Columbia)
Elections
Arts and Entertainment (Entertainment Technology, Literature, Movies, Television), Finance (US Finance, World Finance), Misc (Religion, New Age, etc.), News (Disasters, US News, World News), Politics (UK Politics, US Politics), Science and Technology (Computer Industry, Computer Technology and Benchmarks, Computing Theory, Encryption, Factoring, General Science, Idea Futures and Experimental Claims, Internet, Math, Medicine, Biochemistry, Physics, Space)
Foresight Exchange www.ideosphere.com
Commodities (Gold, Silver), Crop Production (Corn, Soybean), Currencies (EUR/USD, GBP/USD, USD/CHF, USD/YEN), Economic Indicators (ISM Manufacturing PMI, Retail Sales), Employment (Initial Claims, Nonfarm Payrolls), Fuel (California Gasoline, Crude Oil, Crude Oil Inventory, Diesel, Gasoline, Natural Gas, Natural Gas Inventory), Housing Prices (Chicago, Los Angeles, Miami, New York, San Diego, San Francisco), Inflation (CPI), Interest Rates (Fed Funds Rate), Mortgage Rates (1-yr ARM, 30-yr FRM) Hollywood Stock Exchange www.hsx.com (Cantor Fitzgerald)
Hedgestreet www.hedgestreet.com
Entertainment (Celebrities, Movies)
Innovation Futures innovationfutures.com/
Business and Technology Trends (Technology Tipping Points, UK Innovation, Economy and Growth, Financial Markets) Iowa Electronic Markets http://www.biz.uiowa.edu/iem/(University of Iowa)
Political Markets (US Presidential Winner Takes All Market, US Presidential Vote Share Market, Federal Reserve Monetary Policy Market), Economic Indicator Markets, Classroom Markets (Computer Industry Returns Market, Microsoft Price Level Market) Net Exchange www.nex.com Corporate events
News (World, Nation, Challenges, Tech), Money (Financial Markets, Companies, Beyond Numbers), Sports (Major League Baseball, College Football, NFL Football, Tennis, Auto racing, Soccer), Entertainment (Video Games, Movies, Television, Travel)
News Futures (www.newsfutures.com)
Current Events, Entertainment, Financial, Legal, Politics, Sports (Auto Racing, Baseball, Basketball - NBA, Basketball - NCAA, Boxing, Cricket, Football - NCAA, Football - NFL, Golf, Hockey, Horse Racing, Soccer - UK, Soccer- South America, Tennis) World Sports Exchange www.wsex.com
TradeSports www.tradesports.com
Entertainment, Sports (Pro Football, College Football, Baseball, Canadian Football, Women Basketball, Boxing, Golf, Tennis, Soccer, Horses, Auto Racing)
APPENDIX B: Foresight Exchange: Contracts
Category Bid Ask Last Description
Finance 25 29 24 NASDAQ drops below 1000 by 2008 25 47 25 China free floats Yuan by 2007 44 48 44 Krugman awarded Nobel prize by 2040
News: Disasters 25 27 24 Big West Coast Quake by 2010 58 66 63 Another US Terrorist by 2010
News:US News 75 76 75 Whites US Minority by 2060 29 30 30 U.S. Attacks Iran by January 21, 2009 14 16 14 U.S. Quits United Nations by 2012 25 28 25 Non-carnivores >50% in US by 2030
News:World 36 37 36 World Government Before 2100 88 89 89 Bulgaria in EU by 1/1/2011 43 45 44 Japan a Nuclear Power by 2019 33 38 37 Nuclear Weapon Used by 2010 43 46 43 World population > 10 Billion by 2050 40 42 43 World War III by 2050
Politics 64 70 70 Blair PM longer than Thatcher (11/26/2008) 81 82 82 Prince Charles remains heir by 2025 16 18 17 Abortion Illegal in US by 2010 8 10 9 Arnold Schwarzenegger Pres. USA 53 55 54 Democrat elected pres by 2008 37 38 38 Female president before 2014
Science & Technology 22 23 23 15GHz CPU Availability Date by 2005
55 64 64 Internet Explorer market share [it pays 10 × max(IE – 80, 0)] by 2005 52 59 55 Voice beats keyboard 2020 24 25 25 A device can view human mind before 2025 53 57 54 Machine Translation by 2015 35 36 36 Global warming 2000-2030 17 18 17 1 m rise in Sea Level by 2030 93 98 97 Poincare Conjecture Proven by 2030 18 19 19 Cancer Cured by 2010 78 79 79 Cyborgs by 2035 49 59 57 Dinosaur recreated by 2050 25 27 26 Human Organ Farms by 2015 25 27 25 Immortality by 2050 18 19 19 Cold Fusion by 2015 28 31 28 Eventual Collapse of Universe 61 62 61 Chinese Moon Landing by 2020 35 46 35 Moonbase by 2025 77 78 77 Extraterrestrial Life by 2050
Observation date: August 23, 2005.