 Journal of Global Trade, Ethics and Law
1. Introduction
Entrepreneurship, understood as the process of starting and running a new business, is of primary importance to economic growth, especially in the aftermath of economic crises. The economic impact caused by the pandemic (Belitski et al. 2022; Claveria & Sorić 2023) highlights the fundamental role of entrepreneurship in overcoming the new challenges facing the global economy. In this context, measuring and evaluating the levels of entrepreneurial activity becomes essential to provide policymakers with valuable insights on how to best foster it to propel economic growth (Amini Sedeh et al. 2022; Kachuriner & Hrushko 2019).
The only global research source that collects data on entrepreneurship directly from individual entrepreneurs is the Global Entrepreneurship Monitor (GEM), a joint project between Babson College and London Business School initiated in 1997 (Reynolds et al. 1999). Since then, GEM carries out annual survey-based research on entrepreneurship around the world through two surveys: the Adult Population Survey (APS), which provides information on the characteristics, motivations and ambitions of individuals starting businesses, as well as social attitudes towards entrepreneurship; and the National Expert Survey (NES), which looks at the national context in which individuals start businesses. See Reynolds (2022) and Bosma et al. (2021) for a detailed description of both surveys.
As opposed to other business surveys, the APS captures the attitudes, behaviours and expectations of individual adults, providing information on the informal economy, involving unregistered and unrecorded economic activities and jobs, which can be a significant part of the national economy beyond the reach of official statistics, especially in developing countries. Slightly more than 130,000 respondents participated in the APS in 2020 (GEM 2020). The NES focuses on the entrepreneurial context that influences an individual decision to start a new business, and subsequent decisions to sustain and grow that business. For the NES, at least 36 national experts are asked to rate the adequacy, or otherwise, of a set of predefined Entrepreneurial Framework Conditions (EFCs) that range from the ease of access to finance to social support for entrepreneurship (Bosma et al. 2020).
In their seminal work, Reynolds et al. (1999) presented the GEM model, which analyses the relationship between established and new business activity and economic growth at the national level. The GEM model assumes that established business activity at the national level varies with General National Framework Conditions (GNFCs), while new business activity depends on national levels of entrepreneurial opportunity and entrepreneurial capacity, which, in turn, vary with EFCs. The model implies that by controlling for GNFCs governments might ensure superior EFCs and expect higher national rates of entrepreneurial activity that translate to higher rates of economic growth (Reynolds et al., 2005).
Consequently, researchers from different fields have examined the factors that may be influencing entrepreneurship and its relation to a wide range of factors (Abdesselam et al. 2018; Abdullah et al. 2009; Alves et al. 2017; Jafari-Sadeghi et al. 2020; Levie & Autio
2008; Pietrzak et al. 2017; Szerb & Trumbull 2018; Ting et al. 2017; Torres & Augusto 2018). The role of entrepreneurial activity in economic growth—as opposed to other macroeconomic variables such as consumption or investment—makes it a key variable in analysing the effect of a complex amalgam of socioeconomic factors on the state of economies and policymaking around the world (e.g., Dvouletý et al. 2018).
In the present study, GEM data is used to evaluate the dynamic interplay between a set of drivers of entrepreneurship and entrepreneurial activity in 23 countries between 2010 and 2020. While most GEM-based academic studies draw on data from the APS (Álvarez et al., 2014), we combine data from both the APS and the NES together with other socioeconomic variables that measure economic development and inequality. Levie et al. (2014) stressed the importance of combining GEM data with other cross-national databases to increase the range of research questions that can be explored, as well as applying multilevel techniques that take advantage of the cross-country and across-time clustered properties of the GEM data.
In keeping with this approach, we propose a two-step procedure to analyse the resulting panel data by means of Categorical Principal Component Analysis (CATPCA), which is a nonlinear dimensionality-reduction technique that allows analysing qualitative data. The proposed methodology also makes it possible to work with panel data and, in turn, avoids the problems derived from cross-sectional causal analysis. See Pérez and Claveria (2020) for a detailed description of the methodology.
The multivariate procedure used in this study—CATPCA—can be regarded as a complementary technique to multiple correspondence analysis that can handle nominal, ordinal and numerical variables simultaneously and can deal with nonlinearities in the relationships among them. In this study, we use this multivariate procedure to (a) synthesise the information regarding the evolution of 23 variables in the 23 economies into two components, and (b) generate perceptual maps with the relative positioning of the countries and plots that show the interactions between entrepreneurial activity and its determinants.
In a recent review of the literature, Etemad et al. (2022) have recently noted the importance to find new solutions to methodological issues. Therefore, in order to circumvent some of the problems that may arise when dealing with time series from developing countries, such as the presence of outliers, first, all the information was transformed into ordinal variables. This was done by ranking the economies according to the rate of growth of the selected indicators between 2010 and 2020. By assigning a descending numerical value to each country corresponding to its ranking, we obtained a set of categorical data. Second, these rankings were then used as input for the analysis, which is based on CATPCA.
The contribution of the study is twofold. On the one hand, to the best of our knowledge, this is the first attempt to apply CATPCA to evaluate the dynamics of entrepreneurial activity at an international level. The study extends the coverage of previous research by assessing the utility of visualisation techniques in order to shed some light on the complex interactions amongst human development, inequality, and other variables affecting entrepreneurial activity. On the other hand, we propose an alternative approach to analyse the interplay of key factors behind the dynamics of entrepreneurial activity on the positioning of economies with respect to the main attributes affecting it. According to our findings, the relative importance of these determinants of entrepreneurship evolved throughout the decade, which highlights the importance of including a time dimension in the analysis of the drivers of entrepreneurial activity.
The study is structured as follows. First, in Section 2 we present the data that were used and the applied methodology. Section 3 presents the results and, finally in Section 4 we draw some conclusions and offer suggestions for future research.
2. Data and Methodology
To evaluate the dynamic interplay between a wide range of entrepreneurship determinants, inequality and economic development, we combined three different sources of data: GEM data, the Gini index from the World Bank, and the Human Development Index (HDI) provided by the United Nations. The HDI is a composite indicator of life expectancy, education, and income per capita (Alzate 2006), whose growth during the sample period allows us to capture the dynamics of human development from a broader perspective than the strictly economic one, including the educational dimension (Jafari-Sadeghi et al., 2020; Sharma and Virani 2023). Table 1 presents and describes the GEM data used in this study, comprised of variables from both the APS and the NES. We used the definitions provided by the GEM consortium on their web (GEM Consortium, 2022).
The GEM data set has several features that make it particularly well suited for the analysis of the drivers of entrepreneurship at the international level, and its contribution to economic development (Abdesselam et al. 2018; Dvouletý et al. 2018; Estrin et al. 2012; Jafari-Sadeghi et al. 2020). First, GEM is the only globally harmonised data set of individual-level entrepreneurial behaviours across countries. It is based on representative samples of the adult working-age population (18–64 years old) and permits the estimation of prevalence rates of both formal and informal entrepreneurial entries.
Second, GEM data are clustered both across countries and within countries across time, permitting the analysis of country-level associations. Third, the GEM data offer countrylevel cross-sectional time series of up to 15 years for some countries, enabling the study of within-country change in institutional conditions on the same outcomes. Finally, GEM uses several screening questions to ensure that it tracks genuine entrepreneurial activity. For a brief history of GEM, see Levie et al. (2014).

These attractive features of the GEM data have inspired a growing body of research in comparative entrepreneurship that explores associations between country-level attributes and various aspects of the entrepreneurial processes and seeks to link these to meaningful outcome variables (Abdesselam et al. 2018; Autio & Acs 2010; Bowen & De Clercq 2008; Ghosh 2022; Jafari-Sadeghi et al. 2020; Levie & Autio 2011; van Stel et al. 2007). Following Levie et al.’s (2014) suggestions to take advantage of the cross-country and across-time clustered properties of the GEM data, we propose using a two-step methodology based on a multivariate dimensionality reduction procedure that allows a cross-country comparison of the evolution of a wide range of GEM indicators and other macro variables for 23 European countries in the time period comprised between 2010 and 2020.
Multivariate techniques are able to preserve a high level of information from the original data set and make no assumptions regarding the direction of causality between variables. This, coupled with the fact that some of the GEM indicators are bound to present multicollinearity, make the proposed approach an ideal way to work with and draw conclusions from a large number of variables. Principal Component Analysis (PCA) is a widely used method of multivariate dimensionality reduction, however PCA is limited by its requirement of numerical variables and its assumption of linear relationships between data, which could pose problems for a study of this nature. For example, data representing that represent social processes in permanent evolution, such as entrepreneurial activity, are intertwined and prone to nonlinear linkages between them.
For these reasons, we use CATPCA—also known as nonlinear PCA—to cluster and position 23 economies from different regions of the world with respect to a set of socioeconomic indicators, such as development and inequality, the rate of early-stage entrepreneurial activity and its various potential determinants thereof. This technique can be regarded as an extension of traditional PCA (Meulman et al., 2002) and allows the simultaneous treatment of different types of data, including nominal and ordinal data. An additional advantage of CATPCA is that, due to the nonlinear transformations of the variables achieved by optimal quantification, it tends to concentrate more variation in the first few principal components (De Leeuw & Meulman, 1986). This study additionally aims to highlight the utility of CATPCA for visualising relationships.
In the present study, we ranked the 23 countries in decreasing order according to (i) the values of each variable in 2020, and (ii) the growth experienced over the period extending from 2010 to 2020 for each variable. We then assigned a numerical value to each country corresponding to its position, obtaining a set of categorical data that we used to cluster the different states. The grouping of all countries is done by means of CATPCA using IBM SPSS Statistics 27.
3. Results
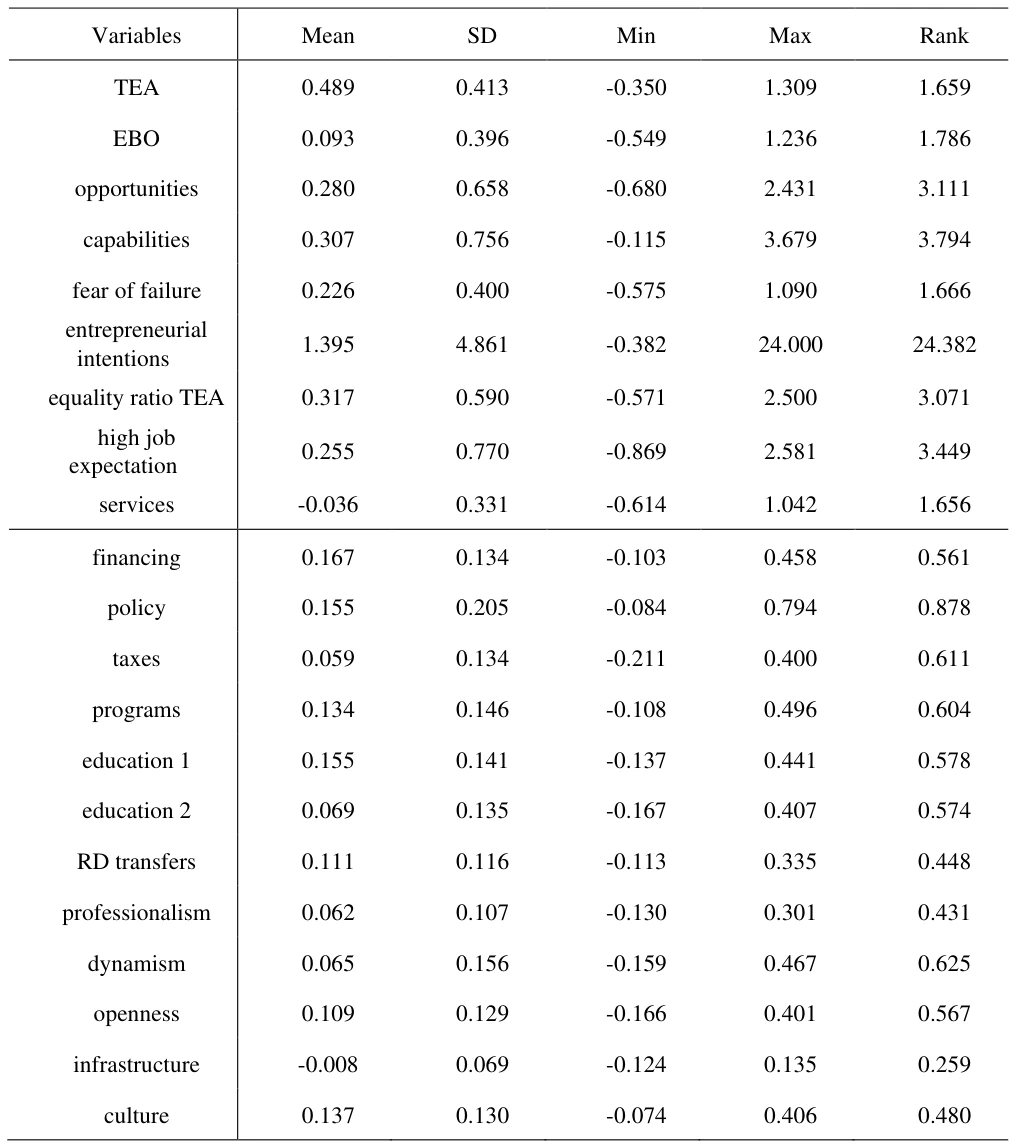
In this section, we implemented CATPCA to (a) reduce the dimensionality of data and (b) generate graphs with the relative positioning of the economies and the interactions between variables. Following Pérez and Claveria’s (2020) two-step procedure, we first ranked the economies in decreasing order for each variable according to the value experienced in 2020 as well as to the growth experienced over the period under study, 2010 to 2020. To capture the dynamic interactions between the different factors, we used the percentage growth rates between 2010 and 2020. In Table 2 we present the summary statistics of all the variables included in the analysis. We can observe that, on average, all variables with the exception of ‘services’ and ‘infrastructure’ experienced an increase during the sample period. That means that only the growth in the share of entrepreneurs in the business service sector and in the assessment of the ease of access to physical resources decreased between 2010 and 2020 across all 23 countries. The growth rate of ‘entrepreneurial intentions’ (the percentage of those who intend to start a business within three years) was, by far, the variable that experienced the highest growth and the highest dispersion.
Next, in Table 3 and Table 4 we present the countries in decreasing order according to the growth experienced during the sample period, from 2010 to 2020. The rankings related to variables 1 through 9 (top panel of Table 2) are presented in Table 3, while those related to variables 10 through 21 (lower panel of Table 2) are presented in Table 4.
Accessible table text
| Variables | Mean SD Min Max Rank |
|---|---|
| TEA EBO opportunities capabilities fear of failure entrepreneurial intentions equality ratio TEA high job expectation services | 0.489 0.413 -0.350 1.309 1.659 0.093 0.396 -0.549 1.236 1.786 0.280 0.658 -0.680 2.431 3.111 0.307 0.756 -0.115 3.679 3.794 0.226 0.400 -0.575 1.090 1.666 1.395 4.861 -0.382 24.000 24.382 0.317 0.590 -0.571 2.500 3.071 0.255 0.770 -0.869 2.581 3.449 -0.036 0.331 -0.614 1.042 1.656 |
| financing policy taxes programs education 1 education 2 RD transfers professionalism dynamism openness infrastructure culture | 0.167 0.134 -0.103 0.458 0.561 0.155 0.205 -0.084 0.794 0.878 0.059 0.134 -0.211 0.400 0.611 0.134 0.146 -0.108 0.496 0.604 0.155 0.141 -0.137 0.441 0.578 0.069 0.135 -0.167 0.407 0.574 0.111 0.116 -0.113 0.335 0.448 0.062 0.107 -0.130 0.301 0.431 0.065 0.156 -0.159 0.467 0.625 0.109 0.129 -0.166 0.401 0.567 -0.008 0.069 -0.124 0.135 0.259 0.137 0.130 -0.074 0.406 0.480 |
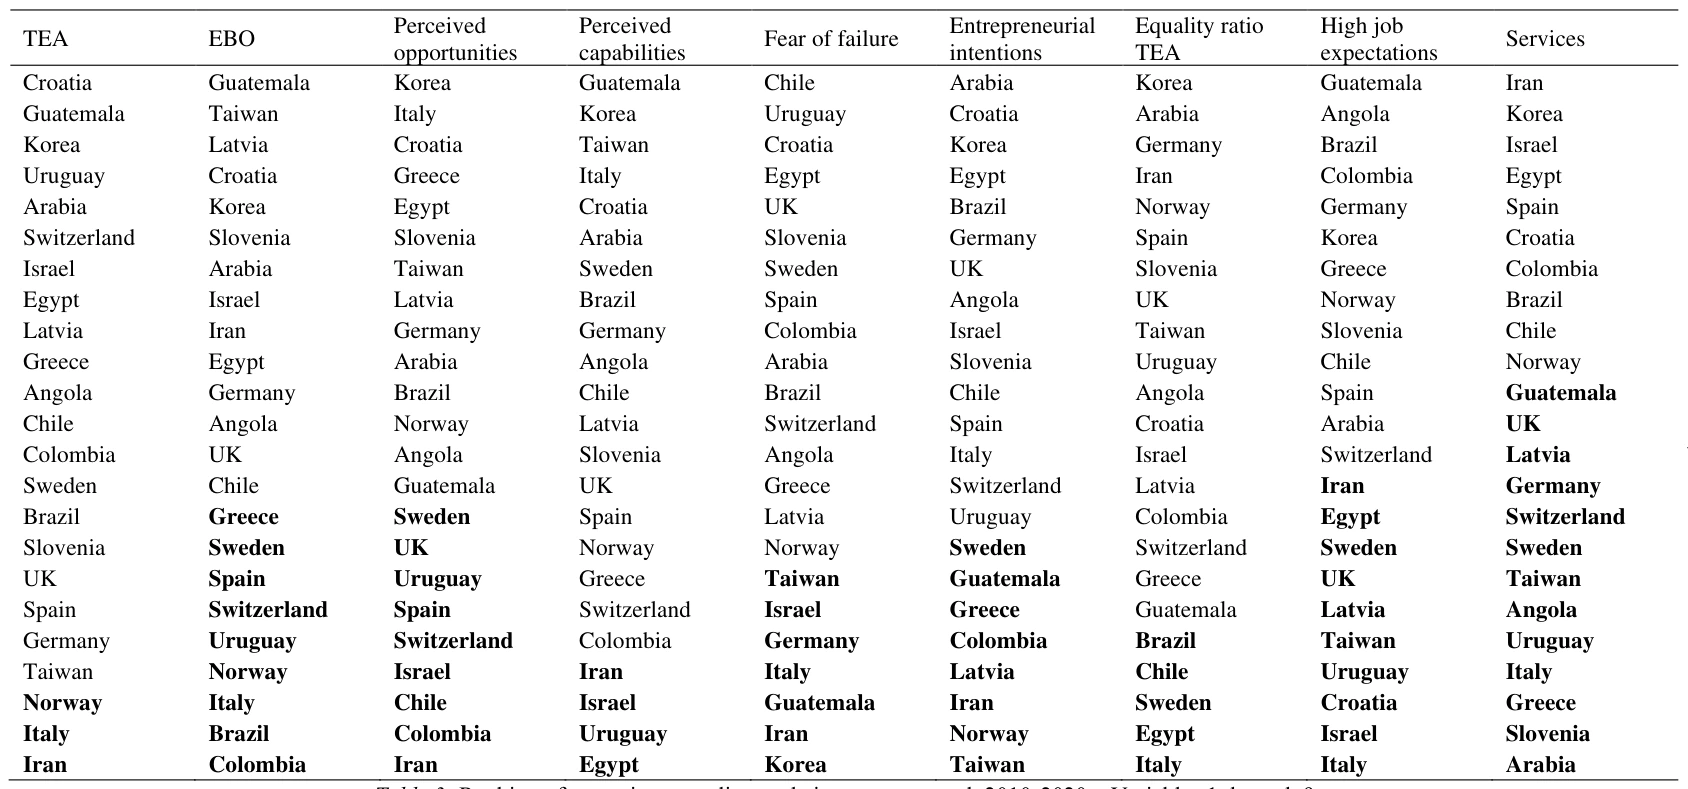
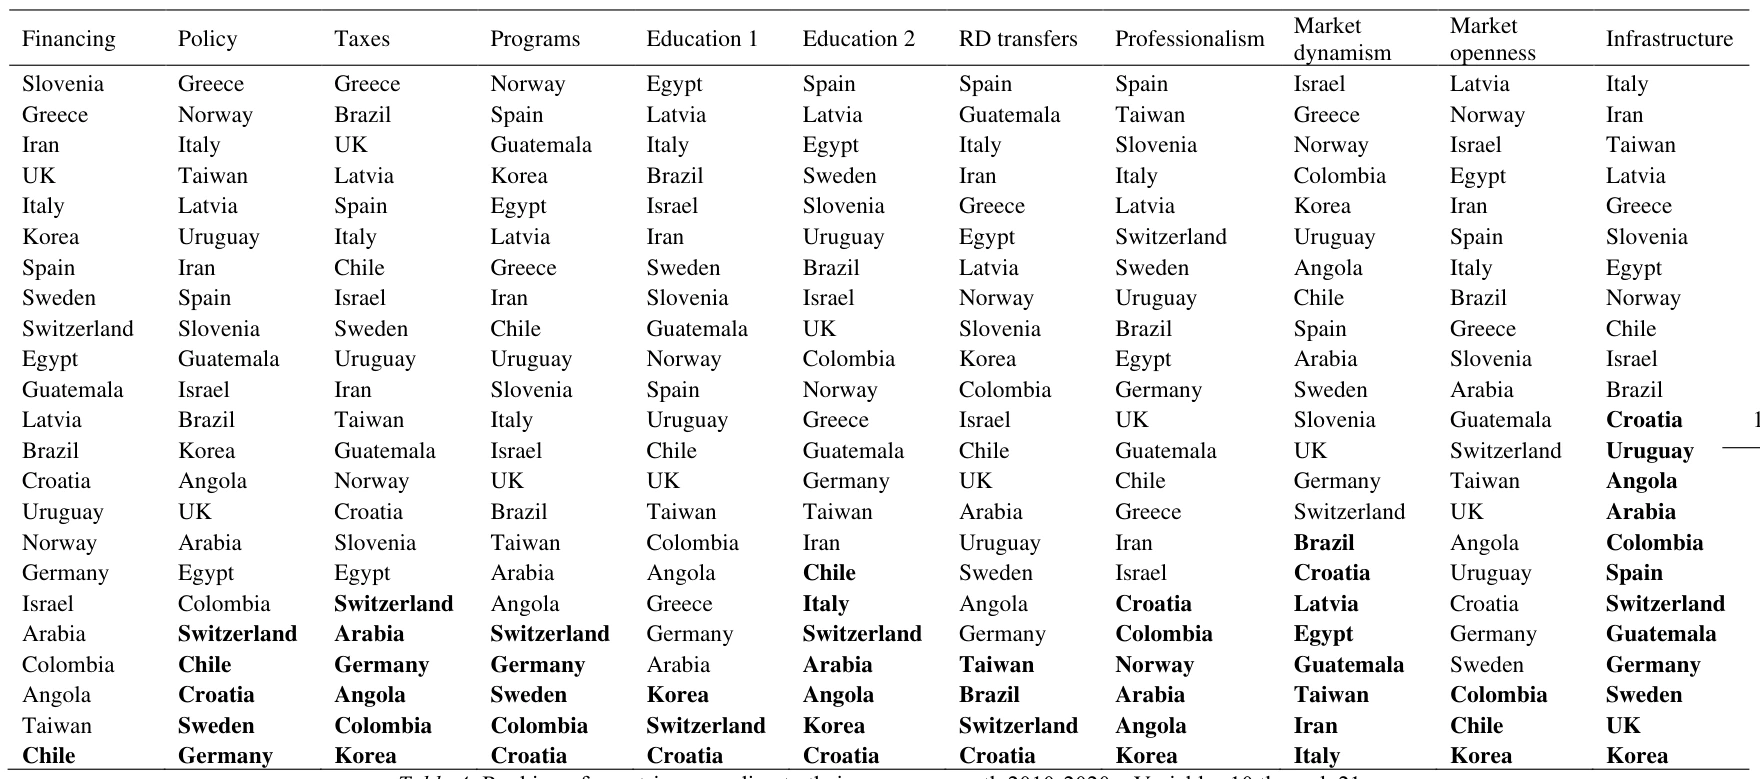
In Table 3 we can observe that Iran, Israel, Italy, and Norway to a lesser extent, tended to show negative growth rates during the decade, and are therefore ranked last in most cases. In Table 4, Chile, Colombia, Croatia and Korea were the countries that tended to be in the lowest positions, showing negative growth rates for most variables. At the opposite extreme, in the top positions in Table 3, we find Croatia, Guatemala and Korea, and in Table 4, Greece, Italy, Spain, and to a lesser extent Guatemala.
In the second phase, we assigned a numerical value to each country corresponding to its position, obtaining a set of categorical data that we used to cluster the different states. We excluded variable EBO from the CATPCA analysis in order to focus on early-stage entrepreneurship, and included two nominal variables to control both for income (high, middle and low income) and region (Africa, Asia and Oceania, Europe and North America, and Latin America and the Caribbean).
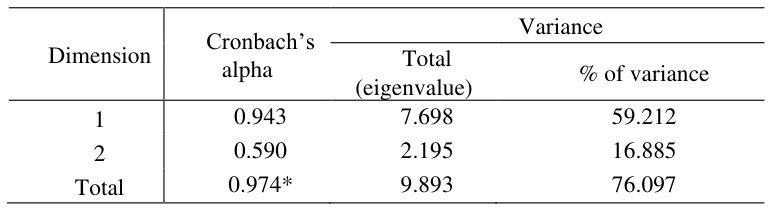
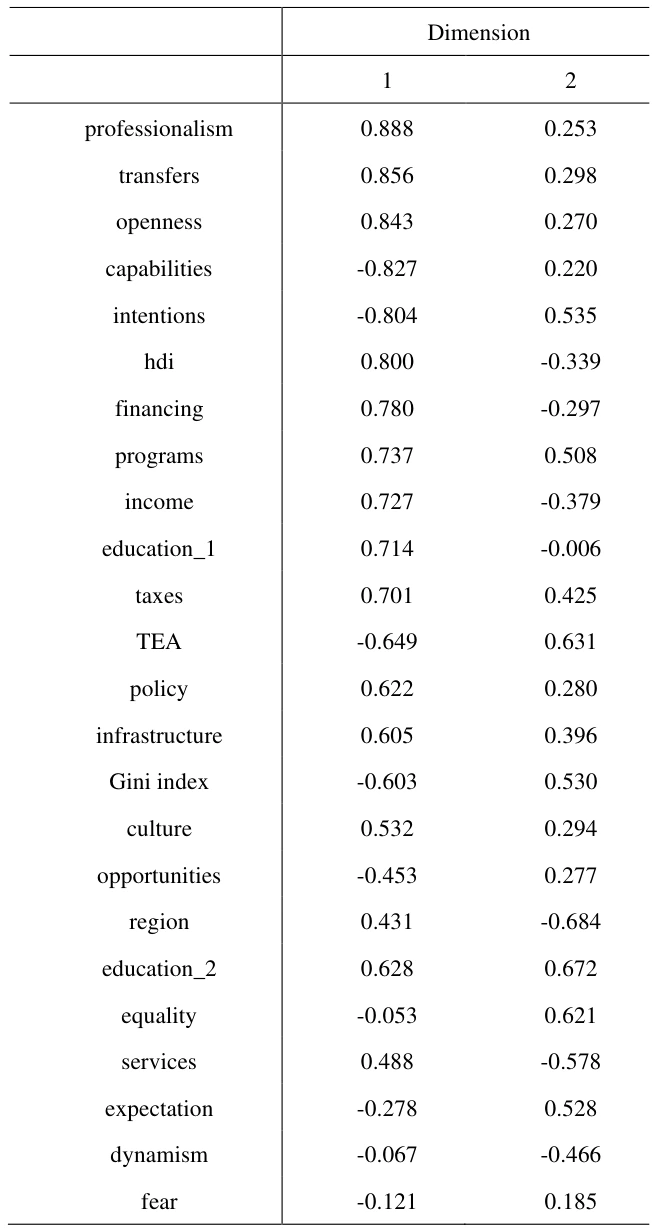
In Table 5, we present a summary of the CATPCA model for 2020. Since the first two factors accounted for more than 76% of the variance of the variables under analysis, we retained these two factors. As mentioned before, CATPCA transforms the original set of correlated variables into a smaller set of uncorrelated variables (Linting et al., 2007), applying a nonlinear optimal procedure that relates the category quantifications to the original categories. See Claveria (2016) for an example.
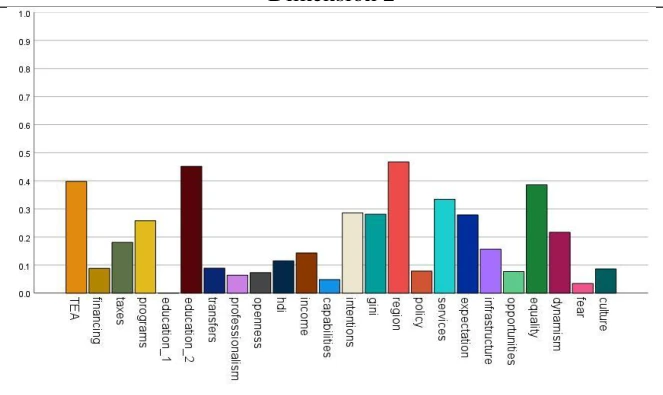
Next, Table 6 shows the obtained component loadings, which we then used to label the two dimensions to which we have reduced the dataset. In Fig. 1, we show the relative weight of each of these components. The factors with the highest loadings in the first dimension are the rankings related to the level of professionalism, RD transfers and market openness in 2020. Therefore, the first dimension better captured the aspects reflecting commercial and legal infrastructure, availability of R&D to SMEs, and the facility for new firms of entering existing markets; whereas the second dimension described those more related to the extent to which training in managing SMEs is incorporated within the education at primary and secondary levels, gender equality and the rate of total early-stage entrepreneurial activity. Accordingly, we labelled the first dimension as “legal infrastructure, transfers and openness” and the second as “education, gender equality and early-stage entrepreneurial activity”.
detailed explanation of all survey variables.
In order to graphically synthesize the results of the analysis, the two-dimensional scatterplot in Fig.2 represents the coordinates of the first two retained dimensions for each country. The top quadrant is completely dominated by the economies of Western and Southern Europe, which ranked high in variables with high component loadings in the second dimension (“education, gender equality and early-stage entrepreneurial activity”), but displayed low positions in the first dimension (“legal infrastructure, transfers and openness”). In contrast, in the lower quadrant, the economies of Latin America predominate. The case of Angola deserves special mention, showing the highest score in the first dimension, followed by Latin American countries. This result suggests that there seems to be also a positioning linked to the geographical location of the countries, which somehow connects with the well-established distinction between ‘opportunity-driven’ and ‘necessity-driven’ entrepreneurial entries (Reynolds et al. 2001).
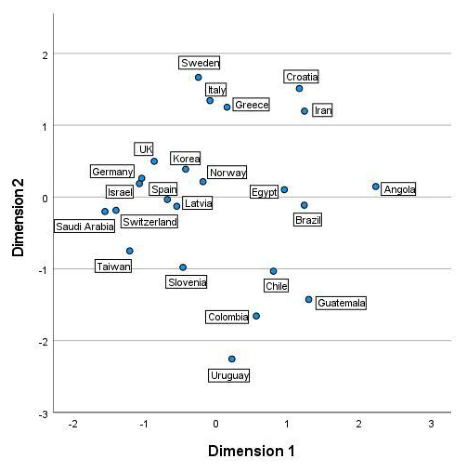
Fig. 3 displays the component loadings (indicators). The coordinates of the endpoint of each vector are given by the loadings of each variable on the two components. Long vectors are indicative of a good fit. The variables that are close together in the plot are positively related, while the variables with vectors that make approximately a 180º angle with each other are closely and negatively related. Finally, variables that are not related correspond with vectors making a 90º angle.
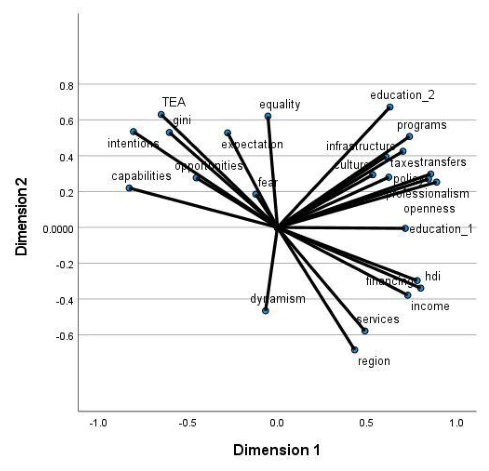
Regarding the interactions among variables, in Fig. 3 we observe that there is a certain level of association between three groups of variables. On the one hand, between the early-stage entrepreneurial activity rate, the Gini index, and entrepreneurial intentions and perceived opportunities (see Pérez-Macías et al., 2022 for a review of the factors that influence the entrepreneurial intention). On the other hand, between programs, infrastructure, R&D transfers, taxes, professionalism and openness. And finally, there is also a positive association between the income level, human development and the availability of financial resources for SMEs, which they in turn show a negative relationship with the first group (TEA, Gini index, intentions and opportunities). This result could be suggesting that the existence of difficulties in accessing financing during 2020 did not seem to be an obstacle to the increase in early-stage entrepreneurship.
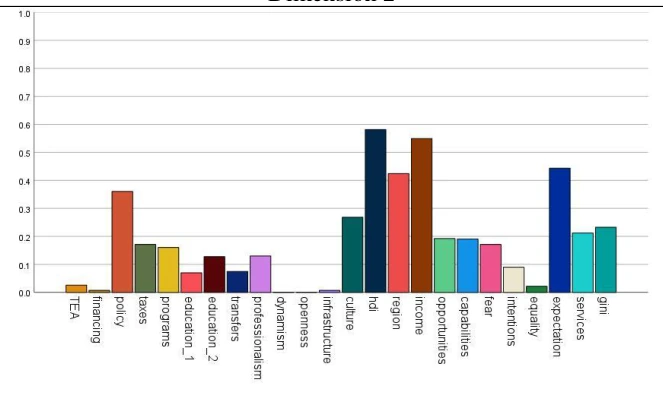
Next, we replicated the analysis for the growth rates experienced during the decade 2010-2020. Fig. 4 shows the variance accounted for in each of the first two dimensions. It can be seen that the ranking related to growth in infrastructure (i.e., the ease of access to physical resources) is the factor with the highest loading in the first dimension, while the ranking regarding growth in the level of income is the one with the highest loading in the second dimension. Accordingly, we labelled the first dimension as “growth in infrastructure” and the second as “growth in income”.
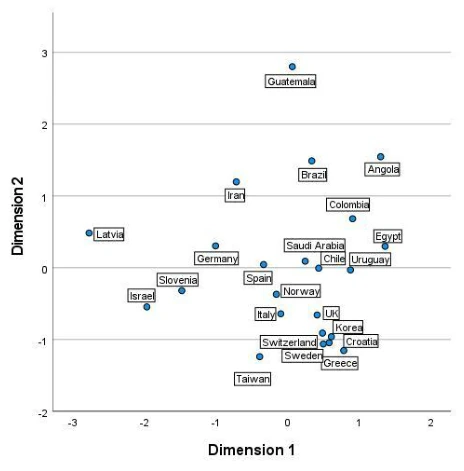
The two-dimensional scatterplot in Fig. 5 represents the coordinates of the first two retained dimensions for each country. In the plot, one can observe a slightly positive slope in the positioning of the economies along both dimensions, which is indicative of a certain relationship between both dimensions (i.e., growth in infrastructure and income). The lower quadrant is completely dominated by the European economies, while the top quadrant is mostly by Latin American countries, which in turn obtained high scores in the second dimension. However, in both quadrants, most economies ranked high in the first dimension, with the exception of Latvia, Slovenia and Israel, which all ranked low in most variables in Table 3. Guatemala, with the top position in the second dimension, is also a remarkable case. Angola, in the second place also deserves special mention, since it also obtained the second position in the first dimension, which somehow hints at an overall improvement during the decade, similar to Brazil. Again, there seems to be also a positioning linked to the geographical location of the countries, especially in the case of European countries, which are clustered together in the lower right cluster, indicating high ranks in the first dimension but low in the second.
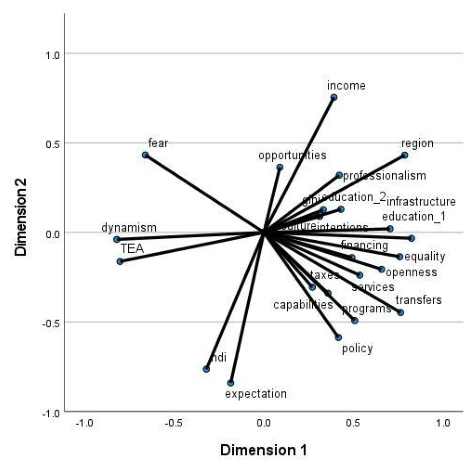
Finally, Fig. 6 displays the interactions among variables. On the one hand, we observe that the growth in TEA was highly associated with the growth in dynamism (i.e., the level of change in markets from year to year), and negatively linked to the growth ‘education_1’ (i.e., training in SMEs at primary and secondary levels). Similarly, the growth in human development and in high job creation expectations (i.e., % of those involved in TEA who expect to create 6 or more jobs in 5 years) showed a link, but they were negatively associated with the growth in the level of income, and practically showed no relationship with the rest of variables. Finally, the growth in R&D transfers, programs and supportive public policies are also connected, and negatively associated with the growth in fear of failure. Overall, these results are in line with recent empirical research (e.g., Abdesselam et al. 2018; Dvouletý et al. 2018), and somehow indicate that the relative importance of the determinants of entrepreneurial activity tends to evolve, highlighting the importance of incorporating a dynamic and an international dimension in the analysis of entrepreneurship drivers.
4. Conclusion
This study aims to provide researchers with an analytical framework to visualise the dynamic interplay between determinants of entrepreneurship, development and other socioeconomic factors, and to position economies with respect to those interactions. The proposed approach is based on a dimensionality-reduction technique that can handle ordinal and numerical variables simultaneously and can deal with nonlinearities in the relationship between them.
With this objective, we first undertook a descriptive analysis of the evolution of a set of variables from two different surveys conducted annually as part of the GEM project over the period extending from 2010 to 2020. Then, countries were ranked according to the observed values in 2020 and the growth experienced over the sample period. We assigned a descending numerical value to each country corresponding to its ranking to generate a set of categorical data. By means of categorical principal component analysis, we synthesised the ordinal information from the rankings into two dimensions and generated a set of graphs to analyse both the relative positioning of the countries and the interactions between the different variables. We replicated the analysis both for the year 2020 and for the growth experienced during the sample period.
First, for 2020, the factors with the highest loadings in the first dimension were those related to the level of professionalism, the availability of R&D transfers and the facility for new firms of entering existing markets; whereas the second dimension described those more related to the extent to which training in managing SMEs is incorporated within the education at primary and secondary levels, gender equality and the rate of total earlystage entrepreneurial activity. However, when the analysis is replicated for growth during the decade, the increase in the facility of access to infrastructure was the most important factor in the first dimension, and growth in the level of income was the one with the highest loading in the second dimension.
Regarding the positioning of countries, in both cases, we observed two clusters that roughly correspond to European and Latin American economies, respectively. Special mention deserves Angola, which obtained top scores in the two dimensions both in 2020 and during the decade. The resulting perceptual map for the analysis in 2020 differs notably from the one obtained for growth between 2010 and 2020, where Angola, Egypt, Iran and Latin American economies were the best positioned in both dimensions when growth is analysed.
Regarding the interactions among variables, the results obtained also differ markedly depending on whether the year 2020 is analysed independently or the growth during the decade. In this sense, while for 2020 it is observed that early-stage entrepreneurship showed a negative association with the availability of financial resources and with human development, when replicating the analysis for the growth during the decade, we obtained a strong link between early-stage entrepreneurship and market dynamism, which in turn showed no connection with human development. This result suggests that the inverse link found for a specific year—between entrepreneurship and access to financing and development—is blurred by introducing a dynamic component in the analysis. This finding highlights the importance of analysing the dynamic relationship between entrepreneurship and its determinants.
This study shows the potential of dimensionality-reduction and data-visualisation techniques to capture the complex set of linkages among entrepreneurship determinants at the international level, human development and socio-economic factors. Our goal is to provide researchers with an alternative approach to identifying key attributes in the positioning of economies. Notwithstanding, this research is not without limitations. First, we want to note that this is a descriptive study, thus generalizable inferences cannot be drawn from the results. A question left for further research is the inclusion of additional variables that could give further insight into other factors operating in explaining entrepreneurship. An additional aspect left for future research is an extension of the analysis to other countries as well as the use of other dimensionality-reduction techniques such as self-organising maps.
Submission declaration statement This research is not under consideration elsewhere, and will not be submitted for publication elsewhere without the agreement of the Managing Editor.
Funding This research was supported by the project PID2023-146073NB-I00 (Sustainable Territories) from the Spanish Ministry of Science and Innovation (MCIN) / Agencia Estatal de Investigación (AEI).
Conflicts of interest/Competing interests The authors state that there is no conflict of interests. The funders had no role in the design of the study; in the collection, analyses, or interpretation of data; in the writing of the manuscript, or in the decision to publish the results.
Availability of data and material The datasets used and/or analysed during the current study are publicly available:
• GEM data: https://www.gemconsortium.org/data. • Human Development Index (HDI) provided by the United Nations: http://hdr.undp.org/en/content/human-development-index-hdi. • Gini Index from the World Bank: http://iresearch.worldbank.org/PovcalNet/index.htm.