 Journal of Global Trade, Ethics and Law
1. Introduction
The analysis of economic uncertainty gains renewed interest since the advent of the coronavirus pandemic and the subsequent economic disruption caused by the lockdown. There is ample evidence that uncertainty shocks have an effect on real activity (Baker et al. 2016; Bloom 2009). Since economic uncertainty is not directly observable, several strategies have been designed to proxy it by: a) using the realized volatility in equity markets (Bekaert et al. 2013; Caggiano et al. 2014), b) estimating econometric unpredictability –understood as the conditional volatility of the unforecastable components of a broad set of economic variables (Jurado et al. 2015; Lanzilotta et al. 2023; Meinen & Roehe 2017)–, and c) computing survey-derived measures of expectations dispersion (Clements & Galvão 2017; Krüger & Nolte 2016; Krüger & Pavlova 2023). The ex-ante nature of this latter approach has generated a growing current in the literature based on this type of metrics (Dovern 2015; Mankiw et al. 2003).
Disagreement measures based on survey expectations make use of prospective information, as agents are asked about the expected future evolution of a wide range of variables. While most studies rely on quantitative macroeconomic expectations made by professional forecasters (Lahiri & Sheng 2010; Oinonen & Paloviita 2017; Zhao 2022), an alternative source of survey expectations are business and consumer tendency surveys, which are increasingly used to proxy economic uncertainty via disagreement in agents’ expectations (Binding & Dibiasi 2017; Claveria & Sorić 2023; Das et al. 2019). See Grimme et al. (2014) for the evaluation of a combination of different types of measures.
The European Commission (EC) conducts monthly business and consumer tendency surveys in which respondents are asked whether they expect a set of economic variables to rise, fall or remain unchanged. We use all the forward-looking information coming from these surveys to proxy economic uncertainty in 32 European countries and the European Union (EU). To this end, we use Claveria’s (2021) geometric indicator of discrepancy to compute the proportion of disagreement among firms and households.
Given that survey expectations: (a) are based on the knowledge of respondents operating in the market, (b) provide detailed information about a wide range of economic variables, and (c) are available ahead of the publication of official quantitative data, the proposed approach to measure economic uncertainty allows us to give a quick snapshot of economic uncertainty amid the COVID-19 pandemic in real time.
The main aim of the study is to provide some insight regarding the recent evolution of uncertainty across economic sectors, economic agents and countries, both from the demand and the supply sides of the economy. As pointed out by Castelnuovo (2022), sectoral data represents a valuable source of information to shed light on the channels responsible of the transmission of uncertainty shocks to the real economy. However, there are practically no studies in the literature that approximate economic uncertainty at a sectoral level. Castelnuovo et al. (2022) employed data on industrial production coming from a variety of production sectors in the United States to estimate sector-specific models. Ma and Samaniego (2019) used firm-level forecast errors on earnings-per-share to estimate sectoral-specific uncertainty, and Segal (2019) proxied uncertainty for the consumption and investment sectors using measures of volatility.
To the best of our knowledge, this is the first attempt to approximate economic uncertainty at a sectoral level by means of business and consumer survey expectations. The remainder of this paper is structure as follows. Next section describes the data and describes the methodological approach to compute disagreement among agents. A graphical analysis is provided in Section 3. Section 4 discusses the results. Finally, Section 5 concludes and provides some recommendations for future research.
2. Data and Methodology
In order to approximate economic uncertainty at a sectoral level, in this study we make exclusive use of firms’ and consumers’ qualitative expectations collected by the EC as part of the Joint Harmonised Programme of Business and Consumer Surveys. These surveys provide information on agents’ expectations regarding a wide range of variables. Business managers and consumers are asked both about their perception of the recent evolution of economic variables (backward-looking questions), as well as the expected evolution of said variables (forward-looking questions). Specifically, we use all forwardlooking monthly raw data from all business and consumer surveys conducted by the EC (see Table 1).

The sample period goes from 2016.M5 to 2020.M2, since we wanted to focus on the evolution of disagreement during the months previous to the coronavirus pandemic. This allowed us to include all the available information from all the surveys in all the 32 economies in which the surveys are now conducted. This is the first study that includes Montenegro, North Macedonia, Albania, Serbia and Turkey, which were recently added to the survey.
In business surveys, respondents are asked about their expectations regarding firm specific factors such as production, selling prices and employment and, they are faced with three options: “up”, “unchanged” and “down”. 𝑃𝑡 measures the share of respondents reporting an increase in the variable, 𝐸𝑡 no change, and 𝑀𝑡 a decrease. The most common way of presenting survey data is the balance, 𝐵𝑡, which is computed as the subtraction between the two extreme categories: 𝐵𝑡 = 𝑃𝑡 −𝑀𝑡.
Consumers, for their part, are asked about objective variables (e.g. how they think the general economic situation in the country will change over the next twelve months) and subjective variables (e.g. major purchases, savings, etc.). Consumers have three additional response categories: two at each end (“a lot better/much higher/sharp increase”, and “a lot worse/much lower/sharp decrease”), and a “don’t know” option. As a result, 𝑃𝑃𝑡 measures the percentage of respondents reporting a sharp increase in the variable, 𝑃𝑡 a slight increase, 𝐸𝑡 no change, 𝑀𝑡 a slight fall, 𝑀𝑀𝑡 a sharp fall and, 𝑁𝑡 don’t know.
The most widespread measures of disagreement among survey respondents use the dispersion of balances as a proxy for uncertainty (Bachmann et al. 2013; Girardi & Reuter 2017; Mokinski et al. 2015). Bachmann et al. (2013) proposed an indicator of disagreement based on the square root of the variance of the balance:

See Dibiasi and Iselin (2021) for a comparison of (1) to Theil’s disconformity coefficient (Theil 1955) and analysis of firms’ direct perception of investment uncertainty. By means of a simulation experiment, Claveria et al. (2019) showed that the omission of neutral responses in (1) resulted in an overestimation of the level of disagreement. As a result, the authors developed a discrepancy metric that incorporated the information coming from all three reply options (P, M and E):
![2+(Et−1 3 ⁄ ) 2+(Mt−1 3 ⁄ ) 2 √(Pt−1 3 ⁄ ) (2) DISCt = 1 −[ ] √2 3 ⁄](/static/article-media/business-and-consumer-uncertainty-during-the-pandemic-a-sector-analysis-in-european-countries/equation-003.png)
Claveria (2018; 2021a) extended this methodology for a larger number of reply options. Assuming a Likert-type questionnaire with K reply options, where 𝑅𝑖,𝑡 denotes the aggregate percentage of responses in category i at time t, where 𝑖= 1, … , K and 𝑡= 1, … , 𝑛, the author derived the following metric of disagreement for any given period t:
![2 √∑ (𝑅𝑖,𝑡−1 K) K 𝑖=1 (3) Dt = 1 −[ ] √(K−1) K ⁄](/static/article-media/business-and-consumer-uncertainty-during-the-pandemic-a-sector-analysis-in-european-countries/equation-004.png)
This measure provides the proportion of disagreement among respondents, and can be regarded as a generalization of (2). This metric is bounded between zero and one, and can be interpreted as follows: 1 denotes maximum disagreement (100%) –indicating that the answers are equidistributed among all response categories–, while 0 corresponds to minimum disagreement, where one category draws all the answers.
When comparing the evolution of the geometric measure of disagreement (3) to that of the standard deviation of the balance (1) in several European countries, Claveria (2021b) obtained a high positive correlation between both metrics of dissension, and found that the main difference between both measures mainly lied in their average level and their dispersion, being DISP more volatile and higher in most countries. See Claveria and Sorić (2023) for an application of the methodology to estimate labour market uncertainty via disagreement in agents’ expectations.
3. Graphical Analysis
In this section, we used qualitative survey data from the five independent tendency surveys conducted by the EC – the industry survey (INDU), the service survey (SERV), the retail trade survey (RETA), the construction survey (BUIL), and the consumer survey (CONS) – to compute the proportion of disagreement among respondents. By averaging the information coming from the different variables in each survey, we computed sector indicators of disagreement, which we in turn used to compute a business disagreement indicator that aggregates the information coming from the four sector indicators. We employed all these indicators to examine the evolution of uncertainty, both from the demand (Fig. 1) and the supply sides of the economy (Fig. 2). Then, in Table 2 we ranked the countries according to their average values of disagreement across the sample.
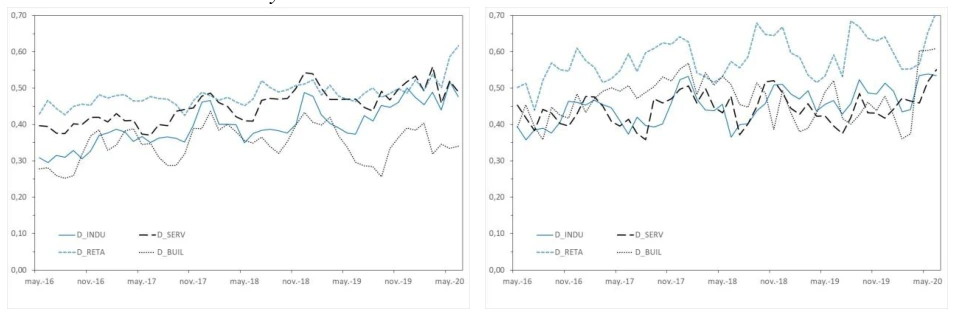
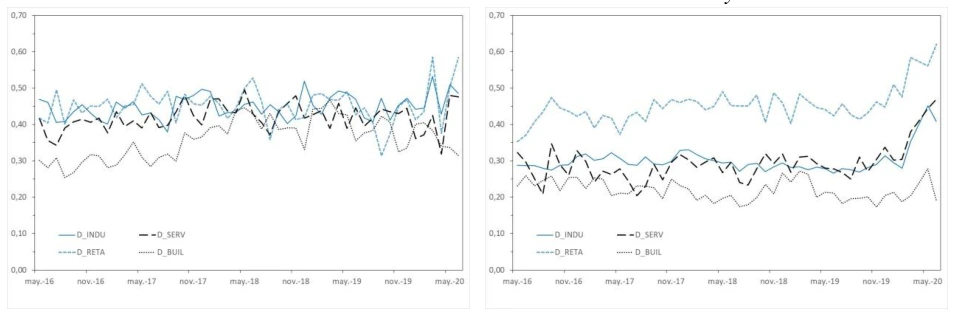
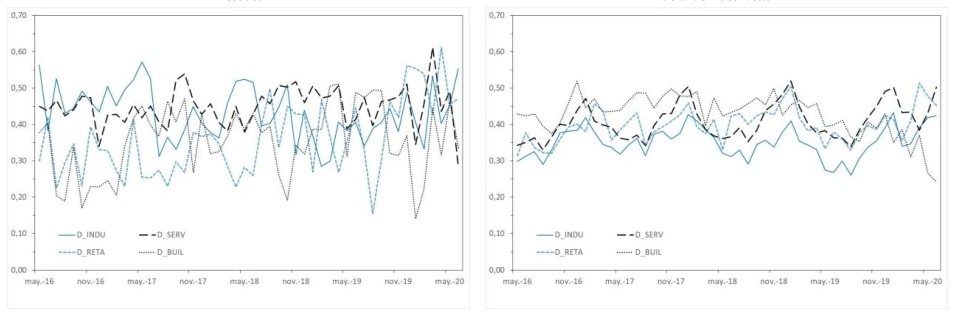
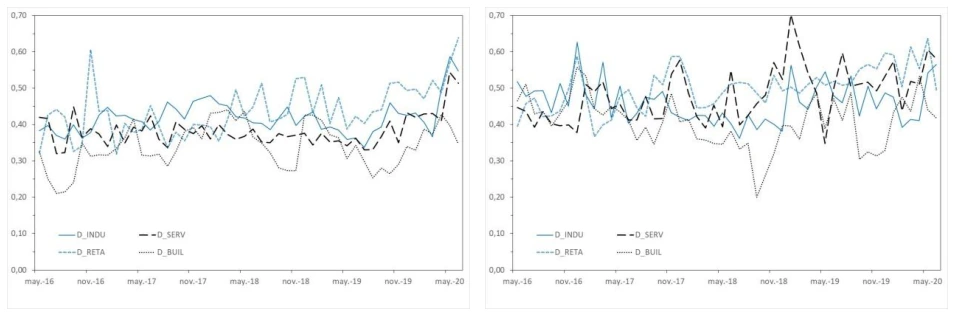


In Fig.1 we observe that the evolution of disagreement varies both across sectors and countries. If we focus on the last months of 2020, when the effects of the first wave of the coronavirus crisis where already palpable, we find different patterns regarding the evolution across sectors. In most cases, disagreement in the industry sector (INDU) starts to decrease in April or May 2020, and in the construction sector (BUIL) even before that. In contrast, disagreement in the service sector and the retail trade sector continues to rise (France, Italy and Estonia).
In Belgium, Germany, Greece, Spain, Croatia, Latvia, Poland or Slovenia retail trade (RETA) disagreement shows an increasing trend as of June 2020. In Finland, Sweden, Lithuania, the Netherlands, Hungary, Portugal, Montenegro, and North Macedonia it is service disagreement that maintains its growing trend. In other countries like Bulgaria, Czechia, Romania, Albania and Denmark, disagreement in all sectors co-evolves, decreasing after April or May 2020, as opposed to Cyprus and the United Kingdom where disagreement in all sectors rises. In Austria and Slovakia industry disagreement does not decrease and shows an increasing trend in June 2020. Cyprus, Greece and Turkey are the only countries in which disagreement in the building sector keeps rising in June 2020.
Next, in Fig.2 we compared the evolution of business disagreement vs. consumer disagreement in each economy.

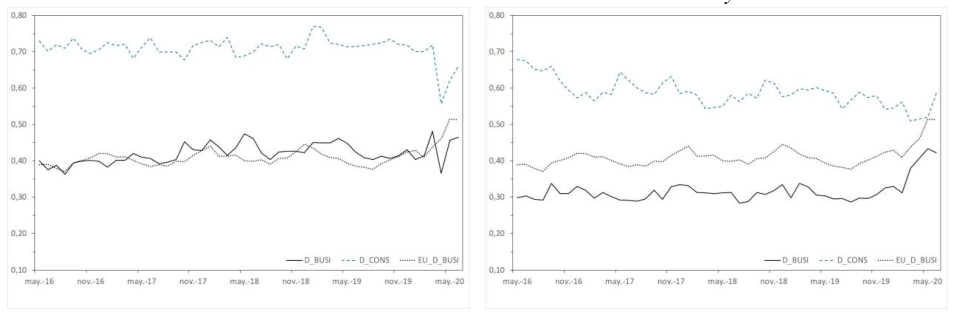

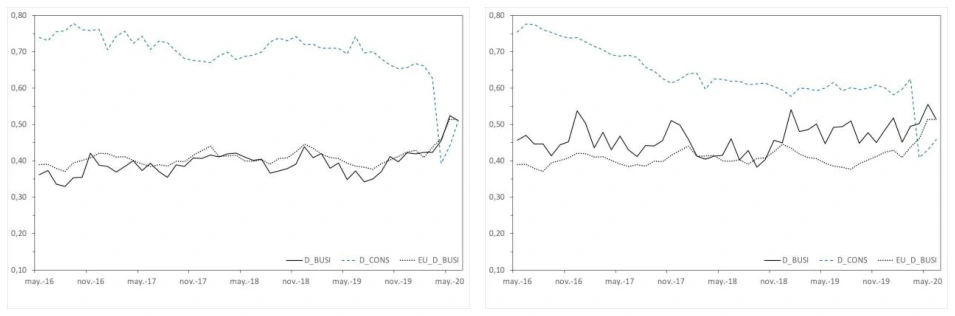
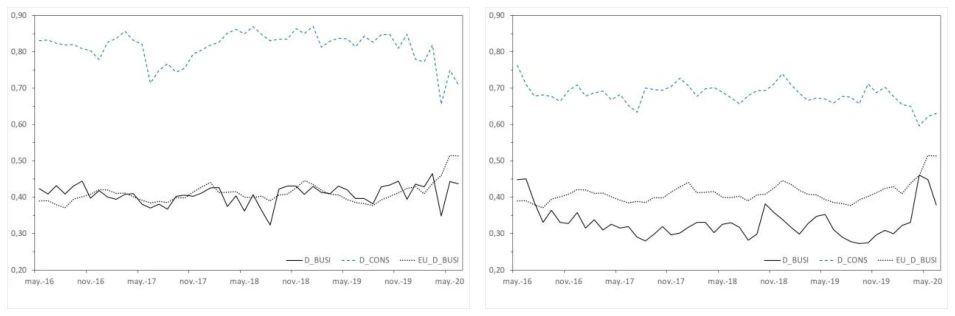
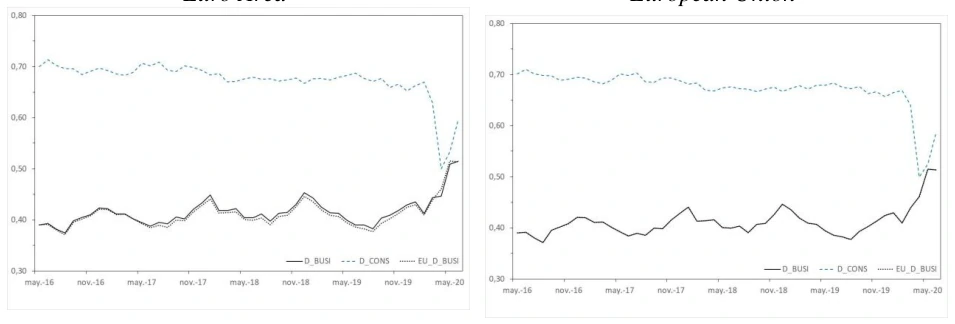
In Table 2, we ranked the countries in increasing order according to their average values of disagreement during the sample period. By incorporating both the EA and the EU, the rankings show the relative position of the different countries analyzed with respect to the eurozone and the union as a whole.

Finally, in Fig.3 we graphed for each survey, the evolution of disagreement across the different questions in each sector. We restricted the analysis to the EU.
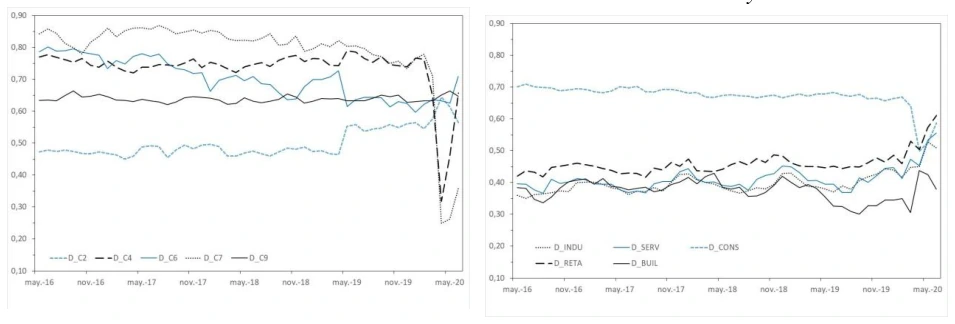
We observe that in most sectors, the evolution of disagreement across sectors follows a similar pattern since the start of the pandemic. The two main exceptions are consumers and the retail trade sector, where we find negative correlations in the evolution of disagreement across questions. Specifically, we observe a great jump in the level of disagreement in the expectations of business activity in the retail trade sector (D_R4) in April 2020. This evolution is similar to the disagreement in the expectations of orders in the retail trade sector (D_R3), and opposed to that of prices and employment in the sector.
Similarly, in Fig.3 we also observe that consumers’ perception of uncertainty, as captured by the metric of disagreement, strongly diverges across questions. While disagreement about the expected general economic situation (D_C4) and expected unemployment (D_C7) experienced a major downturn at the beginning of the pandemic and then a sudden recovery in April 2020, disagreement regarding expectations about price trends (D_C6) and major purchases (D_C9) experienced the opposite evolution.
Finally, when comparing the evolution of aggregate disagreement indicators for the respective sectors and consumers, we observe inverse trajectories between businesses and consumers. However, since May 2020 we found a divergent evolution in industry and construction, which began to decrease, while uncertainty in service and retail continued to increase.
4. Discussion
The analysis of the evolution of economic uncertainty during the coronavirus pandemic was done by approximating it through a geometric-based disagreement indicator. This approach allowed us to make use of business and consumer survey expectations about a wide range of economic variables from different sectors (industry, retail trade, services and construction), as well as different agents (managers and consumers). By applying Equation (3), we transformed the survey response shares into the proportion of disagreement for each question, thus being able to proxy economic uncertainty in the different sectors considered in the study.
The inverse trajectory of aggregate disagreement in business sectors and consumers, suggests differences between managers’ and consumers’ expectations. Claveria (2021b) obtained similar results when comparing manufacturing firms and households. However, since May 2020 we observed a divergent evolution in industry and construction, which began to decrease, while uncertainty in service and retail continued to increase. This result is in line with a recent study by Meyer et al. (2022), in which the authors found that firmlevel risk perceptions skewed heavily to the downside in spring 2020. Similarly, Altig et al. (2020) considered several economic uncertainty indicators for the US and UK before and during the COVID-19 pandemic, and found that all indicators showed huge uncertainty jumps in reaction to the pandemic and its economic fallout, but that peak amplitudes differed greatly between the different proxies. Taking as reference the financial crisis prior to the pandemic, Reifschneider and Tulip (2019) also found evidence that estimates of uncertainty about future real activity in the US increased after the crisis.
The possible reasons for the divergence between the evolution of economic uncertainty between managers and consumers may be due to different factors. On the other hand, it should be noted that the uncertainty measure used in the study is an indicator of disagreement, that captures the proportion of discrepancy among agents’ expectations. On the other hand, another reason for this finding is the different nature of the questions between business and consumer surveys, in the sense that managers’ expectations refer to firm-specific factors, while consumers’ expectations refer to the general economic situation. Finally, the greater heterogeneity that would be expected in the sample of households compared to that of companies, can also help explain why the average degree of dissatisfaction of consumers is higher than that of companies, and that it evolves inversely. As noted by Lahiri and Sheng (2010), aggregate forecast uncertainty can be expressed as the disagreement among the forecasters plus the perceived variability of future aggregate shocks. Therefore, it could be the case that this last component of forecast uncertainty, that is, the expected variability of aggregate shocks, is much larger among consumers. Consequently, the inherent difference in the composition of both groups of respondents could be explaining the different results found regarding the evolution of disagreement between both types of agents.
5. Conclusion
This paper examined the evolution of economic uncertainty during the COVID-19 crisis at a sector level. The analysis was carried out in 32 European countries and the European Union (EU). Since uncertainty is not directly observable, we approximated it using a geometric discrepancy indicator. This approach allows quantifying the proportion of dissent in business and consumer expectations. To the best of our knowledge, this is the first attempt to proxy economic uncertainty at a sectoral level by means of disagreement indicators.
We used information from all monthly forward-looking questions contained in Joint Harmonised Programme of Business and Consumer Surveys conducted by the European Commission –the industry survey, the service survey, the retail trade survey, the building survey and the consumer survey–. First, we calculated a discrepancy indicator for each of the 17 forward-looking survey questions available, allowing to proxy the proportion of uncertainty about different aspects of economic activity, both form the demand and the supply sides of the economy.
We computed the degree of disagreement at the sector level for all countries and graphed the evolution of economic uncertainty up to June 2020. In most sectors, the evolution across variables followed a similar pattern since the start of the pandemic. The only exception is the retail trade sector. Similarly, consumers’ expected uncertainty strongly diverged across questions: disagreement regarding the expected general economic situation and unemployment experienced a major downturn at the beginning of the pandemic and then a sudden recovery in April 2020, as opposed to disagreement about expected price trends and major purchases.
This analysis attempted to offer a global overview of the degree of economic uncertainty in the midst of the coronavirus crisis at the sectoral level. The obtained results provide a snapshot of economic uncertainty –proxied via indicators of disagreement built with business and consumer survey expectations– in European countries in the midst of the coronavirus pandemic. These findings give insight regarding the different evolution of uncertainty across economic sectors and agents.
The differences observed between managers and consumers with respect to the evolution of expected uncertainty highlight the importance of analyzing economic uncertainty from a disaggregated perspective. This result is of great relevance for researchers, especially when evaluating the impact of uncertainty shocks at the aggregate level on economic activity, since the net effect may be attenuated when there are notable differences between the risk expectations of the different types of agents, for example managers versus consumers. Therefore, the obtained results point to the importance of working with sectoral data to understand the different dynamics triggered by uncertainty shocks in different sectors.
Finally, we want to note some of the limitations of the present study. On the one hand, it should be highlighted that the findings of this research may be conditioned by the approximation of economic uncertainty, which has been estimated by means of disagreement among agents’ survey expectations. On the other hand, we want to point out the differences in the nature of the questions between business and consumer surveys, in the sense that managers’ expectations refer to specific factors of the company, while consumers’ expectations refer to the general development of economic activity.
However, the main aim of this research was to advance in the sectoral analysis of economic uncertainty, making use of information from tendency surveys. In this sense, an issue left for further research is the comparison of the considered discrepancy metric with other disagreement measures and with other uncertainty methodologies to proxy uncertainty, thus shedding light on the differences between the alternative approaches to measuring economic uncertainty. Another question left for further research is to evaluate the effect of uncertainty shocks at the sectoral level on the specific activity of each sector.
Funding This research was supported by the project PID2020-118800GB-I00 from the Spanish Ministry of Science and Innovation (MCIN) / Agencia Estatal de Investigación (AEI). DOI: http://dx.doi.org/10.13039/501100011033.
Conflicts of interest The author states that there is no conflict of interests. The funders had no role in the design of the study; in the collection, analyses, or interpretation of data; in the writing of the manuscript, or in the decision to publish the results.
Availability of data and material The dataset used and/or analysed during the current study is: The Joint Harmonised EU Consumer Survey conducted by the European Commission, which can be freely downloaded at: https://ec.europa.eu/info/business-economy-euro/indicatorsstatistics/economic-databases/business-and-consumer-surveys_en.