 Journal of Global Trade, Ethics and Law
1. Introduction
The study focused on the relationship between capital ratios and the cross-section of bank stock returns. Capital ratios are a comparison between a banking firm's core equity capital and total risk-weighted assets. Capital ratios are also known as capital adequacy ratios. Capital adequacy ratios (CARs) are an amount of the bank's core-capital articulated as a percentage of its risk-weighted asset. Capital adequacy is determined by a comparison between the main equity banking firm and total risk-weighted assets. Core equity firm known as its Tier 1 capital is a measure of the financial stability of the bank based on the amount of equity capital and disclosed reserves, and sometimes nonredeemable non-cumulative preference shares. Risk-weighted assets include all assets of the company the firm believes that systematically weighted for credit risk. Central banks tend to develop weight scales for different classes of assets, such as cash and coins, which have zero risks, compared with a credit, which carries more risk. In other words, capital adequacy ratio is defined as: CAR = (Tier 1 capital + Tier 2 capital) / risk-weighted assets. Tier 1 capital = (paid-up capital + statutory reserves + disclosed free reserves) - (equity investments in subsidiary + intangible assets + current and between losses). Tier 2 capital = (undisclosed reserves + general loss reserves + hybrid debt capital instruments and subordinated debts).
If we want to check the economy of any country, the stock market is an important tool to test out the economy of that country. In 2011 Mr. Bashir tells that’s with the help of the stock market we can measure the economic performance of a country that this country is how much strength in the economy. If we talk about Pakistan there is Karachi Stock Exchange (KSE) market to measure the performance of Pakistan economy, in which we can get the information about the GDP, Companies and Banks performance, Trade input and output, Labor-force, Taxes, and Business ups and downs, etc.
Basle discussions in 1988 between G10 countries, struggled to unite restrictions of capital between countries requiring the banks to maintain their capital adequacy based on risk, not less than 8%. Later, the BIS capital ratio (Bank for International Settlements) has long been used as an important tool for bank controllers to judge the protection of banks. Banks with greater BIS capital ratios were considered safer than those with a low BIS ratio of capital because they have more shield capital to shocks. The latest financial crisis recaps us that the book-valued capital cannot function as support that does not allow banks to liquidation as we expected earlier when the value of their assets drops. Furthermore, even the regular BIS is well planned to begin with it may soon become outdated as fast improvement in the banking industry may deliver a means of controlling arbitrage to demoralize the usefulness of regulation. Thus, the BIS capital ratio may not be a proper measure of the riskiness of banks.
Fama & French, (1992) explained the relation between average return and book-tomarket value, β firm size and leverage, they said that firm size has a positive effect on average return but it affects differently on average return by a long and short time, if we talk about a short time, in a short time of period firm size has low effect on the average return and for a long time of period its highly effect on average return. Second leverage also has a positive effect on average return, third book-to-market value has a negative effect on average return.
The asset-pricing model of Sharpe (1964), Lintner (1965), and Black (1972) were suggested that the size of any organization effect positively and liner on profit. Markowitz (1959) said that in the market portfolio expected return positively impact on (slope of regression). Banz (1981) explains that the size of an organization is an important tool to check the profit and outcome of that organization. Basu (1983) demonstrates that profit value proportions (E/P) help clarify the cross-area of normal profits for U.S. stocks in tests that additionally contain size and market. Black, Jensen, and Scholes (1972) and Fama & MacBeth (1973) find that, as anticipated by the SLB demonstrate, there is a positive basic connection between normal stock returns and amid the pre-1969 period.
Dewatripont & Tirole (1994) advised that market information has the perspective of improving the valuation of bank capital capability, reproducing the outcome of changes in macroeconomic circumstances timely. According to Flannery (1998) alternatively, market assessments of the banks are usually sensible and timely valuation of the monitoring show that associated with the empirical literature review. Acharya, Pedersen, Philippon, and Richardson (2010) develop the market-based measure of risk to help forecast the performance of the share of banks during the current bank loan crisis. In fact, they give the impression of agreement among previous studies that financial markets are capable to deliver beneficial information about bank risks that may be related to the seven administrative objectives, although they diverge significantly from each other in the approaches used to examine the connection between the market and the risk assessment and ways to measure risk or the enclosure of info about the market.
William Sharpe (1964) and John Lintner (1965) added two new and very important assumptions in Markowitz theory to clarify portfolio that effective on mean-variance because of these two assumptions and the asset pricing model (CAPM) Sharpe have Nobel Prize in 1990, the first key assumption is t-1 is time where market clearly asset prices, mean investors agree to invest in market at asset returns from time t to t-1, and the second assumption based on lending and borrowing at risk-free rate. Banz (1981) described that the relationship between firm size and stock returns, after his investigation he derive that there is a strong negative relationship between firm size and stock returns. Basu (1983) explained the relationship between average returns and earning per year (E/P), he was used a one-factor model to check the relationship between them he got the result that there is a positive relationship between earning per year and average returns. Bhandari (1988) explains that leverage is a positive effect on average return.
2. Literature Review
William Sharpe (1964) and John Lintner (1965) delivered first time the asset pricing model (CAPM), which time till now asset pricing theory is still a useful measure of risk and relationship between risk and expected returns. The basic theory behind the asset pricing model (CAPM) is the model of a portfolio which Harry Markowitz explained in
1959, in his model he explained that whenever investors invest money in any company they select different portfolios at time t-1 that produce the expected returns in future at t. In this mode whenever invertors choose portfolio they just care about that portfolio mean and variance which give them idea about investment returns if variance of portfolio is minimized it’s mean investors expect that they got good returns but if variance is maximized of portfolio then they expect that return will be not good they have lost that’s why Markowitz theory name is mean-variance model.
Merton (1973) builds up the intertemporal capital resource valuing model (ICAPM) to catch the multi-period part of monetary business harmony. Ross (1976a, 1976b) proposed the Arbitrage Pricing Theory (APT). Breeden (1979) proposes the utilization-based model. A great deal of CAPM inconsistencies has been demonstrated over the long run. If he takes a gander at the observational test, Basu (1977) and Another inconsistency is found by Banz (1981). In his paper, he finds that lots of firms with low market ratios have higher normal returns than substantial underwriting stocks. These two disagreements are not joining, and little firms tend to have higher returns, even in the wake of controlling for E/P. One more disagreement originates from the propensity of profits to invert over long skylines. In this relationship, Bondt & Thaler (1985) find that those stocks that have had poor returns in the course of the last three to five years have much higher normal returns than "champs" through the following three to five years. Basu (1983) explained that CAPM exact disappointment by demonstrating that stocks with high profit/ value proportions (or low P/E proportions) earned fundamentally higher returns than stocks with low-income value proportions, and this impact is not simply sawed among little promotion stocks. Basu's studies are affirmed by Jaffe, Keim & Westerfield (1989), who demonstrated how this impact shows up not just in January. The presence of this impact makes CAPM disappointment in light of the fact that the beta ought to be the only thing that matters, and its most certainly not.
Fama & French (1993) investigate whether this negative connection between capital adequacy and market estimated average return on equity significantly be attributed to differences in the impact of risk factors.
Chopra, Lakonishok & Ritter (1992) demonstrated that beta can't represent this distinction in normal returns. Furthermore, there does not exist such beta ready to legitimize the arrival distinction thus the CAPM. One more disagreement in the CAPM originates from Bhandari (1988), which incorporates the influencing variable, as an element of normal returns, aside from size and beta. High influence builds the peril of an association's value, yet this expanded danger ought to be reflected in a higher beta coefficient. CAPM is a monetary model that clarifies stock returns as a component of business return. The primary distinct opinion for CAPM is the Three-Factor Model proposed by Fama & French (1992). In this model, size and book to market variables are incorporated as explanatory variables. An immense measure of reactions of CAPM has risen over time, and numerous creators, as to propose option models to enhance it. There exist a few samples of these CAPM changes models.
Fama & French (1995) to explore the cross-sectional change of bank stock returns through portfolios sorted on market capital adequacy is estimated to check stock prices properly reflect differences in the relative bank efficiency
Another CAPM inconsistency originates from the energy. Jegadeesh (1990) finds that stock returns have a propensity to show transient force. A study by Jegadeesh & Titman (1993) affirms these outcomes. Their study additionally shows that the force is more grounded for firms that have had poor late execution. Because of the absence of consistency of CAPM, Fama & French (1992) proposed a model that controls for size, influence, E/P, BE/ME, and beta in a solitary cross-sectional study. Their outcomes are disputable. To start with, they find that the beforehand recorded a positive connection in the middle of beta and a normal return is because of the negative connection between firm size and beta. At the point when this connection is represented, the connection in the middle of beta and return vanishes. The positive connection in the middle of return and beta is exceptionally direct, as anticipated by the CAPM. In light of this proof, it creates the impression that the CAPM pleasantly clarifies the higher returns that little firms have earned. Anyway, when the beta is permitted to fluctuate without controlling for size, the positive, straight beta-return connection vanishes. This outcome repudiates the focal forecast of the single-period CAPM. Then again, taking every one of these variables (size, influence, E/P, BE/ME, and beta) in the model doesn't appear to tackle the CAPM issues. When they run cross-sectional relapses from 1963 to 1990, it appears that BE/ME and size are the variables that have the most grounded connection to returns. The logical force of alternate variables vanishes when these two variables are incorporated in the relapses. The cross-segment of normal stock returns can be pleasantly depicted by two variables.
Shimizu (2007) and Chen (2011) took the lead in Japan for the analysis of dynamic motion as BIS ratio and market-valued relations for separate banks and then determines that the capital adequacy ratio of the market value is a good sign of the solidity of banks. Hokkaido Takushoku bank which unsuccessful in November 1997 one more Ashikaga bank, which suffered bank securities in the season of 1997 and then received government release money. They also explain that the capital market-valued assign for assessing the riskiness of banks. In specific, he considers the cross-sectional connection between the ratio of market capitalization and bank efficiency-valued shares of listed Japanese banks. It originates those banks with a low capital ratio of market-valued had a higher yield than the average of banks with higher ratios of capital Market-valued. Nevertheless, his demonstration that this negative connection between capital adequacy and market expected average stock returns can fundamentally be official to variations in the impact of risk factors.
Rajan (2005) and Acharya, Pagano & Volpin (2011) also showed that it is difficult to separate a priori of different explanations for creating importance stock market: they observed that for some large bank’s growth in stock market values before the crisis took place on the back to create hidden efficient risks, whereas for others it reproduces the relative organizational abilities.
Gandhi and Lustig (2010) and Martins (2012) investigated about large and small bank crises that happened in the US in 2009 FDIC 95 small or mid banks shad down and in Lehman 2008 collapse large financial institute failed, he got result that large banks and institutes have stock returns greater than small banks and large banks, not shad down like small banks. They test 15 European countries and got the result that if the interest rate and general market condition do not change than the connection between real estate returns and bank stock returns are positive, in other words, he explained that if we increase real estate price than our bank sock returns also increase but the condition is there no fluctuation in interest rate and another general market state.
In this study we scrutinize the relationship between capital ratios and cross-section of bank stock returns on Pakistan banking sector, and check the impact of capital ratios on banks stock returns, on profitability, on efficiency on Pakistani banking sector and fast we check the banks size effect on the relationship between capital ratios and cross-section of bank stock returns on Pakistan banking sector, in previous studies, many researchers check the relationship between capital ratios and cross-section of bank stock returns on different countries but on one check that relationship on Pakistani banking sectors and this is first that we are going to check the banks size effect on the relationship between capital ratios and cross-section of bank stock returns on Pakistan banking sector.
2.1. Empirical Review
Ahmed (2015) reviewed the literature in favour of and against the effects of trade openness on the severity of multi-dimensional poverty. The study backed up the claim that trade openness limits efforts to reduce multidimensional poverty and its severity in MENA nations. This emphasized the need for governments to offer supplemental measures designed to help individuals living in severe poverty benefit from trade openness.
Kebede et al. (2016) used a computable general equilibrium Micro-simulation method to examine how trade liberalization affected Ethiopian poverty. According to the report, tariff reductions are projected to have a significant impact on the industrial sector that is based on agriculture, particularly in the textile and leather industries. Estimates of poverty showed an increase in both cases. In comparison to 2.3 percent under a uniform tariff system, a total tariff drop raises poverty at the national level by 2.8 percent. In both cases, entrepreneur households experience greater poverty rises than agricultural and wage employee households (3.2 percent in the uniform tariff cut scenario) (0.9 percent and 1.5 percent, respectively).
Kebede et al. (2016) examined how trade liberalization influenced Ethiopian poverty using a computable general equilibrium Micro-simulation approach. The analysis predicts that tariff reductions will significantly affect the agriculturally based industrial sector, particularly the textile and leather industries. In both situations, estimates of poverty revealed an increase. A comprehensive tariff reduction increases national poverty by 2.8 percent as opposed to 2.3 percent under a system with uniform tariffs. Entrepreneur households see higher increases in poverty in all scenarios (3.2 percent in the uniform tariff cut scenario) than agricultural and wage labour households (0.9 percent and 1.5 percent, respectively).
Tariq et al. (2018) looked into how trade liberalization affected employment, how it affected poverty reduction, and how it affected Pakistan's economic growth. According to the study's findings, trade openness and per capita income in the industrial sector have a negative link in the short term while having a favourable relationship in the agricultural sector. In the long run, trade liberalization has an inverse relationship with per capita GDP and a positive link with per capita income in the agricultural and industrial sectors, employment, and inflation.
Adegbemi et al, (2018) looked into the relationship between trade liberalization and poverty in 21 African nations between 2005 and 2014. The results showed that while exchange rates and trade openness were adversely correlated with poverty levels at the five percent level, foreign direct investment and inflation rate had a positive link with the human development index.
3. Research Objectives
In this research, we are going to investigate the cross-sectional relationship between
market-value capital ratios and bank stock returns.
3.1. Specific Objectives
The specific objectives of this study are: • To analyse whether there is any relationship between market-value capital and bank stock returns. • To check the relationship between market-value capital ratios and average future returns if there have a common risk factor. • To analyse whether there is any relationship between market-value capital on bank stock returns and bank profitability (future returns) in the financial crisis. • To analyse whether the market-value capital ratios have an impact on bank profitability (future returns). • To analyse whether there is bank size has any effect on the relationship between market-value capital ratios and bank stock return.
4. The hypothesis of the Research
In this study we explain that if we want to find riskiness of banks, there a market-valued capital ratio (MLR) as an indicator to measure the riskiness of banks, after examining the cross-section relationship between market-value capital ratios and banks stock returns on Pakistani banking sector then we know that banks with lower market capital ratios have had higher average stock returns of banks than banks with higher market capital ratios, it means there is a negative relationship between market-value capital ratios (MLR) and banks stock returns (SR). Our this idea is based on the relationship between risk and expected returns when we find risk and expected returns with asset pricing model, asset pricing theory explain that if any company or bank have high risk than these companies or banks got high returns and based on this theory we find our first hypothesis that banks with lower market capital ratios have had higher average stock returns of banks than banks with higher market capital ratios, it's mean there is negative relationship between market-value capital ratios and banks stock returns. Second hypothesis we find by Fama & French models. Chen (2011) these three hypotheses were used in Japan listed banks, but we will test these three hypotheses in Pakistan listed banks, and fourth hypotheses related to the relationship between size and bank stock return which Fama & French used in 1992.
H1: Banks with lower market-valued capital ratios have on average higher succeeding stock returns than banks with higher market-valued capital ratios.
In this hypothesis, after we analysis than find that there is a negative connection between the market value and the average capital adequacy ratio of stock returns, which is reliable with our first hypothesis, we would follow the method in the following Fama & French (1993) investigate whether this negative connection between capital adequacy and market estimated average return on equity significantly be attributed to differences in the impact of risk factors.
H2: The market-valued capital ratio proxies for sensitivity to risk factors that capture the cross-sectional variation in bank stock returns.
This hypothesis shows that while the above hypothesis lies in the most important part of the essence of the connection implied risk-return explanation, asset pricing models also suggest that a high ratio of the capital market is estimated should also be linked with consistently high bank efficiency. We follow Fama & French (1995) to explore the crosssectional change of bank stock returns through portfolios sorted on market capital adequacy is estimated to check stock prices properly reflect differences in the relative bank efficiency.
H3: Banks with higher market-valued capital ratios are obstinately more efficiency and profitable than banks with lower market-valued capital ratios.
This hypothesis shows that is there has any relationship between market-value capital and bank efficiency after we test this hypothesis we saw that there is a positive relationship between market-value capital ratios and bank efficiency. Asset pricing models suggest that riskier banks must submit higher average yields to attract investors to keep them, just because they are doing poorly in bad times, such as when the banking system as a whole is in trouble. Therefore, we assume that the dynamics of the bank's shares during the financial crisis are positively associated with his attitude of marketvalued capital before the crisis.
H4: Banks size has a positive effect on the relationship between market-value capital ratios and bank's stock return.
This hypothesis shows that their banks size has any the effect on the relationship between market-value capital ratios and banks stock return after we can use Fama & MacBeth one factor model we get the result that there is the size of bank has a positive effect on the relationship between market-value capital ratios and banks stock return. In other words, those banks have a high size of banks value they have a strong relationship between market-value capital ratios and banks stock return than those banks which have lower banks asset size. We would follow the method in the following Fama & French (1993, 1992) where he found that size has a positive effect on the relationship between market-value capital ratios and banks stock return.
H5: Performance of banks in the financial crisis has a mixed effect on profitability and the relationship between market-valued capital ratios and bank stock returns.
The last hypothesis shows the effect of market-valued capital ratios on stock returns in the financial crisis from 2008 to 2010. After analysis the data by used Fama & French (1993, 1995) research we get the mixed effect on profitability and relationship between market-valued capital ratios and bank stock returns.
5. Research Methodology
5.1. Data
The data for this study was conducted from the Karachi Stock Exchange of 21 listed Pakistani banks, which examine the market valued capital ratio and cross-sectional relationship with bank stock returns. Our main data source is based on two types, one the is Financial Statements Analysis of banks listed the at Karachi Stock Exchange and the other is a Stock Database. The financial statements analysis of banks listed at the Karachi Stock Exchange contains information about capital ratios, shares, dividends, and other relevant accounts and stock databases used to collect information about stock prices for all listed banks of Pakistan.
We take stock price data each year from December to next year December and other data we also take financial statements analysis each end year.
After taking data then we arrange data into three different portfolios, the first is a low portfolio second is a medium portfolio and the third is a high portfolio sorted by these market-value capital ratios.
In a low portfolio, we obtain those data whose market-value capital ratios values are higher than 9% in the year 2018, similarly, in a medium portfolio we take individuals data whose market-value capital ratios are higher than, 7% and in a high portfolio we have those that in which market-value capital ratios lower than 7%.
Similarly, in previous studies, Chen, (2011) take data same as the in Japan banking sector for the three-factor model, Rossi (2012), collect the Italian Stock Exchange data for test three-factor model and Blanco (Spain), (2012) also take data same as this method for his research.
5.2. Data Type
The Auto-regressive Distributive Lag (ARDL) is adopted in this study. The study considers both the long-run and short run simultaneously, using the co-integrating ARDL approach and Error correction ARDL approach.
5.3. Data History
In this study we use data from 2005 to 2018, this time was chosen because it is characterized by intense return volatility with historically high and low returns for all listed banks in Pakistan. Stock price data we started from December 2005 and end December 2018 but all data we started 2006 to 2018.
5.4. Populations
In this research, we chose the Pakistan banking sector as a population.
5.5. Sampling
We use 14-year previous annual data at the Karachi Stock Exchange (2005 to 2018) for 21 banks. We take annual data for each bank. We chose those banks that have all the data we need in this research. In our given sample, all banks must have stock prices available from December to the next year till December and we take stock price data to form Karachi Stock Exchange and other data we collect in Financial Statements Analysis of Pakistan Financial Sector.
6. Findings
6.1. Variables
In this study, we have two main variables: the first one is capital ratios and the second is bank stock returns.
6.1.1. Independent Variables
A functionally variable whose value determines the value or values of other variables, in simple independent variables represent inputs or causes, or test to see if they are due.
Independent variable in this study is capital ratios because we are checking that, the market-value capital ratios have what impact on banks stock return, so when capital ratios rise or fall in price than the market-value capital ratios have a direct effect on bank stock returns, we calculate capital ratios by taking total equity of bank than divide by total asset of that bank and we take stock return for bank annually than subscribe of previous year value in of next year value and divide by previous year. In previous studies different researchers used market-value capital ratios as an independent variable like Chen in 2012 test market-value capital ratios impact on banks stock returns, Rossi (November 2012) also test capital ratios in three-factor model, D. Wall (2014), Yonetani & Katsuo (1988) Oliver, Ruano & Fum (2013) are also take market-value capital ratios as independent variable.
Similarly, when we analyse the one-factor model, then in the one-factor model there is one independent variable that is RM_t-RF_t explaining to take market-returns for each year subtract in risk-free rate market-returns change in year t to t+1.
When we see the two-factor model, in two-factor model, there are two independent variables LMH and BMH, first variable LMH locate to sorted portfolio by banks asset than subtract low portfolio values in high portfolio values, and third variable BMH find that sorted portfolio by market-value capital ratios than subtract low portfolio stock return values in high portfolio values.
When we test the three-factor model, we have three independent variables in the threefactor model RM_t-RF_t, LMH and BMH. In RM_t-RF_t variable, we take marketreturns for each year subtract in risk-free rate (bonds rate) market-returns change in year t to t+1, second variable LMH locate to sorted portfolio by banks asset than subtract low portfolio values in high portfolio values, and third variable BMH find that sorted portfolio by market-value capital ratios than subtract low portfolio values in high portfolio values.
6.1.2. Dependent Variables
Depended variables are those variables which depend on independent variables if we can change values on independent variables then it will be affecting dependent variables in our study we also have dependent variables that we will be mentioned below.
We analysis the one-factor model, two-factor model, and three-factor model for our study just have one dependent variable and that variable is R_it-RF_t in which first we take stock price than we take stock returns.
The dependent variable in this study is bank stock returns because when Capital ratios change than it has an impact on the bank's stock returns, in other words, banks stock returns depend on Capital ratios. Barbosa & Saldías (2013), Chen (2011), Gandhi & Lustig (2010) and Foong, Lok & Hoon (2012) all do work on the stock return as a dependent variable.
6.2. Market-value capital and cross-section of bank stock returns
In this section, we explain the strong negative relation between market-value capital ratios and banks stock returns after examining the cross-section relationship between market-value capital ratios and banks stock returns on Pakistani banking sector than we know that banks with lower market capital ratios have had higher average stock returns of banks than banks with higher market capital ratios, it is mean there is negative relationship between market-value capital ratios (MLR) and banks stock returns (SR).
Value-weighted sorting (sorting by MLR)
Accessible table text
| — | — | — | — | Mean(MLR) | — | — | Std. Dev. | — |
|---|---|---|---|---|---|---|---|---|
| — | High | — | — | -0.0252473 | — | — | 0.3681726 | — |
| — | Medium | — | 0.0370341 0.3899385 | — | — | — | — | — |
| — | Low | — | — | -0.0015011 | — | — | 0.4999571 | — |
| — | Spread | — | 0.0237462 0.2999571 | — | — | — | — | — |
6.2.1. Estimated result for average returns of portfolios sorted on market-valued
capital ratios
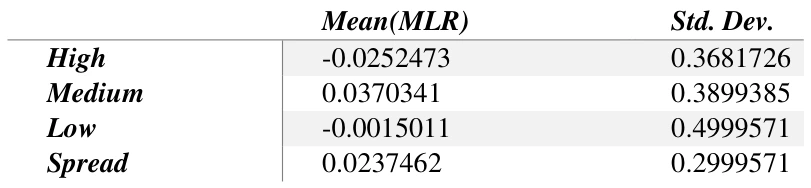
This table 2 estimated the average returns and standard deviation for sorted portfolio base on market-valued capital ratio our full-time period starts in 2005 and end in 2018, in Table 2 sorted by sorted based on market-valued capital ratio and sorted by valueweighted portfolio (low, medium, high and spread) and spread portfolio we get by subtracting low portfolio in high portfolio, Chen (2011), Blanco (2012), Fama & French (2004) and Fama & French (1992) disuse about portfolio.
When we observe in this table row first sorted by value-weighted portfolio first-row high market-value capital ratio and the value of average stock return value is -0.0252473 and in third row the market-value capital ratio vale is low then here the average stock return is -0.0015011 that proof our first hypothesis that market-value capital ratios have negative relationship on average stock returns.
Table 2, we are sorting portfolio by market-value capital ratios value-weighted than we saw that there also have same like asset pricing model, that if banks have market-value capital (MLR) high than these banks have stock returns low and if banks have marketvalue capital low than these banks have stock returns high, similarly in this table when we have market value high than have banks stock returns low, in low portfolio that sorted by equal-weighted have market-value capital low that why its banks stock returns higher than other two portfolios (medium and high).
6.3. The market-valued capital ratio proxies for sensitivity to risk factors that capture the cross-sectional variation in bank stock returns.
In this section, we find expected to return by using Fama & French models one-
factor, two-factor, and three-factor.
6.3.1. Regression analysis
We use a regression model to check that in Pakistan when market-value capital ratio changes than what changes come in bank stock returns.

This regression equation we use in this research 𝑅𝑖 is banks stock return that changes in time i, 𝑀𝐿𝑅𝑖 is the market-value capital ratio that also changes in time i and 𝜖𝑖 is error term.
6.3.2. Fama & French regression analysis
We use this mode to conclude the influences of the independent variables on the dependent variables. It's also used to determine the relation of the variables between each other. Regression is a numerical measure that effort to conclude the strength of the association between one dependent variable (usually denoted by Y) and a series of other fluctuating variables (known as independent variables).
The two elementary kinds of regression are linear regression and multiple regressions. The linear regression uses one independent variable to explain and/or forecast the result of you, while multiple regressions use two or more independent variables to estimate the consequence.
The data collection depends on the Fama & French model described below such as: The focus of modern asset pricing theory is that the price of security measures expected discount future payoffs.

After assorted algebra, change the above equation as follows.


6.3.3. Fama & MacBeth regression analysis
Fama & MacBeth in 1973 give a new concept that the market-value capital ratios have an impact on returns of banks or not.

In equation (4) 𝑅𝑖,𝑡+1 is the return of bank i over the period t to t + 1,𝜒𝑖, indicate the capital ratio (MLR or BIS) of bank i at time t, 𝜖𝑖,𝑡+1represents estimate errors or standard error. The estimate of 𝛽𝑡 measuring the connection between capital ratios and bank stock returns as the time-series average of the cross-sectional regression estimates. We estimate time-series regressions for the market model, a two-factor model without the market factor, and a three-factor model including the market factor as follows.

Equation (5) estimate the cross-section of bank stock return on market return, the first factor 𝑅𝑖𝑡 −𝑅𝐹𝑡 indicate the return on sorting (low, medium, high and spread) portfolio of banks related to market-valued capital ratio subtract in risk-free rake (bonds rate), 𝑅𝑀𝑡 −𝑅𝐹𝑡 is denote market-return of bank i over the period t, in equation (6) second factor LMH is indicating to subtract low portfolio in high portfolio after sorting portfolio by market capitalization than arrange them (low, medium and high) portfolio.
The third factor denoted as BMS is the return on a factor-mimicking portfolio of banks related to size, same as take LMH but portfolio sorting by market-capital.

When we saw in previous research, then they're mostly researchers were used threefactor model to check future returns, few of them we mention here Rossi (2012) also test capital ratios in three-factor model, D. Wall (March 2014), Chen (2011), Blanco (2012), Fama & French (2004) and Fama & French (1992).
After estimate all the data that we take for the three-factor model we get these results which are shown below.
Value-weighted portfolios

High Medium Low Spread
Intercept (-0.104)**
(-0.008)
(-0.029)
(-0.075)**
(0.071)
(0.061)
(0.053)
(0.043)
RM-RF (1.086)**
(0.962)**
(0.952)**
(0.134)**
(0.297)
(0.256)**
(0.225)
(0.221)


High Medium Low Spread

LMH (0.171)**
(-0.076)
(0.181)**
(-0.010)**
(0.135)
(0.114)
(0.136)
(0.142)
BMS (-0.222)**
(-0.227)**
(-0.052)**
(-0.170)**
(0.097)
(0.078)
(0.065)
(0.087)

Accessible table text
| — | High | Medium | Low | Spread |
|---|---|---|---|---|
| Intercept | (0.0250) (0.057) | (-0.033)** (0.047) | (-0.016) (0.067) | (0.041) (0.066) |
| RM-RF | (1.054)** (0.194) | (0.826)** (0.212) | (0.882)** (0.260) | (0.172)** (0.231) |
| LMH | (0.031) (0.074) | (0.034)** (0.078) | (0.034) (0.105) | (-0.001) (0.010) |
| BMS | (-0.222)** (0.0495) | (-0.145)** (0.055) | (-0.044)** (0.046) | (-0.178)** (0.043) |
| 𝑹𝟐 | 0.861 | 0.801 | 0.663 | .643 |
6.4. Estimated result for when sorted by value-weighted portfolio
Table 4 estimates the result for the risk-adjusted result of portfolios sorted on marketvalue capital ratios panel (A, B and C). We estimate three models to check banking performance in Pakistan same as Fama & MacBeth (1973), Fama & French (1993), Blanco (2012), Fama & French (2004) and Fama & French (Sep 1992) and Chen (2011) using these models in other countries for other sectors. When we see in panel (A) Market model: Rit −RFt = αi + βi(RMt −RFt) + ϵit sorted by value-weighted portfolio there have two variable independent variable is RMt −RFt, and dependent variable is Rit − RFt, the result for intercept first row sorted by market-value capital ratios (low, medium, high and spread) show that in intercept, all four values (low, medium, high and spread) portfolio are negative and two of them (low and spread) are significant at 5% confidence interval, and an independent variable, highest value between (low, medium and high) is 1.086 which belongs in high portfolio and other two portfolio values lower than this value and the lowest value between (low, medium and high) portfolio belong in low portfolio that value is 0.952 and spread value is 0.134 that is difference between low and high portfolio, and r-square value in low portfolio is 0.620, in medium portfolio is 0.563, in high portfolio is 0.548 and in spread, portfolio is 0.576. The one-factor model explains the relationship between risk and expected return so in our results shows that if we sorted portfolios according to the market-value capital ratios than those banks which banks have higher market-value capital ratios they have higher returns from those which have lower market-value capital ratios which show us there is positive relationship between marketvalue capital ratios and stock returns if risk factor is there it's mean higher the risk higher future returns.
In Table 4 when we distinguish panel (B) Two-factor model: 𝑅𝑖𝑡 −𝑅𝐹𝑡 = 𝛼𝑖 + 𝛾𝑖𝐿𝑀𝐻𝑡 + 𝛿𝑖𝐵𝑀𝑆𝑡 + 𝜖𝑖𝑡 in two-factor model two variables (LMH, BMS) are independent and one variable 𝑅𝑖𝑡 −𝑅𝐹𝑡 is dependent, in this panel two values are positive and significant at 5% confidence interval, the LMH lowest value between (low, medium and high) portfolio is -0.076 this value belong in medium portfolio and the highest value between (low, medium and high) is 0.181 that value belongs to low portfolio and spread value is different between low and high portfolio. if we see standard error second row of intercept, the standard error in intercept values is positive and the lowest value between (low, medium and high) portfolio is 0.113 that belongs to the medium portfolio.
When we observe Intercept in panel (B) Two-factor model, sorted by market-value capital ratios, in intercept two values (low and high) portfolio are positive between (low, medium and high), and one value (low) portfolio is significant at 5% confidence and the highest value between (low, medium and high) portfolio is 0.073 that belong to low portfolio and the lowest value belong to medium portfolio this value is -0.017 and in Intercept second-row standard error.
When we perceive BMS in panel (B) Two-factor model, sorted by market-value capital ratios portfolio, in BMS all four values (low, medium, high and spread) portfolio are negative and all four values are significant at 5% confidence interval the lowest value between (low, medium and high) is -0.227 that value belongs to medium portfolio and the highest value between (low, medium and high) belong to low portfolio that value is -0.052. The r-squared value for a low portfolio is 0.232, the medium portfolio value is 0.464, the high portfolio value is 0.408 and the spread portfolio value is 0.321. Fama & French two-factor model relationship between size and book to market value on future returns and here in this paper we relationship between them by sorting banks in marketvalue capital ratios which shows us that if market-value capital ratios involve here than book to market value have positive effect on future return and size have negative effect on future because we arrange all banks by market-value capital ratios those which have higher market-value capital ratios we put them in high portfolio and medium marketvalue capital ratios put in medium portfolio and high market-value capital ratios put in higher portfolio than in higher portfolio we arrange banks by banks size to get BMS which subtract top 50% banks into bottom 50% banks in every year. In higher portfolios have lower size banks and in the lower portfolio have the higher size of banks that’s why here the relationship between size and future is negative.
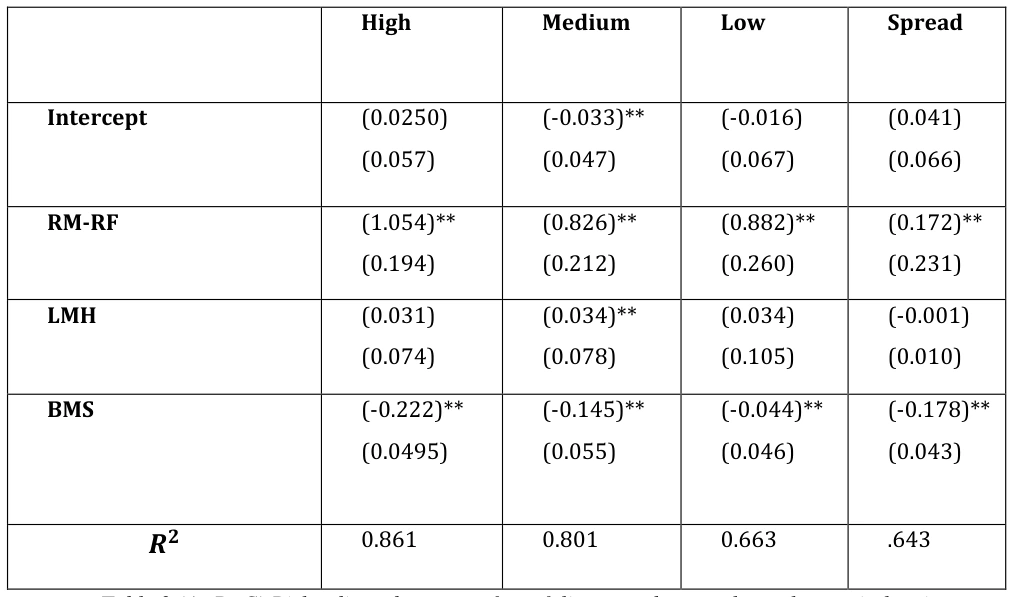
When we distinguish Table 4 estimates the result for risk-adjusted result of portfolios sorted on value-weighted portfolio, in the panel (C) Three-factor model: 𝑅𝑖𝑡 −𝑅𝐹𝑡 = 𝛼𝑖 + 𝛽𝑖(𝑅𝑀𝑡 −𝑅𝐹𝑡) + 𝛾𝑖𝐿𝑀𝐻𝑡 + 𝛿𝑖𝐵𝑀𝑆𝑡 + 𝜖𝑖𝑡 in three-factor model have three variables independent (𝑅𝑀𝑡 −𝑅𝐹𝑡, LMH, and BMS) and dependent variable is one that is (𝑅𝑖𝑡 −𝑅𝐹𝑡), the first in intercept two (medium and low) portfolio are negative, and the highest value between (low, medium and high) portfolio is 0.0250 which belong to high portfolio and the lowest value belong in medium portfolio that value is -0.033 and spread value is difference between low and high, and medium portfolio value is significant at 5% confidence interval level.
When we see first variable 𝑅𝑀𝑡 −𝑅𝐹𝑡 four values (low, medium, high and spread) portfolio that sorted by market-value capital ratios are positive and significant at 5% confidence interval level, and the lowest value between (low, medium and high) is 0.826 this value belongs to medium portfolio and the highest value between (low, medium and high) portfolio is 1.054 this value belongs to high portfolio.
When we observe second variable LMH all three values (low, medium and high) portfolio are positive and the highest value between (low, medium and high) portfolio is 0.034 and this value belongs to medium portfolio, and the lowest value between (low, medium and high) portfolio belong to high portfolio that value is 0.031 and between these three portfolio values (low, medium and high) only medium portfolio is significant at 5% confidence interval level.
When we perceive third variable BMS in the panel (C) Three-factor model, between four portfolio values all four portfolio value (low, medium, high and spread) are negative, the highest value between (low, medium and high) belong to low portfolio and that value is -0.044, and the lowest value between (low, medium and high) is -0.222 this value belongs to high portfolio and between all four portfolio values (low, medium, high and spread) all are significant at 5% confidence interval and in panel (C) Three-factor model, r-square value in low portfolio is 0.861, in medium portfolio is 0.801, in high portfolio is 0.663 and in spread, portfolio is 0.643.
Our results show that there is positive relationship between market-value capital ratios and bank stock return with risk factor sorted by market-value capital ratios, in our results mostly values are significant and 5% confidence interval and in Fama & French one, two and three-factor models all banks we sorted by MLR from high to low, and banks size also have positive effect on future return if sorting by market-value capital ratios same as privies studies D. Wall (March 2014), Blanco (2012), Fama & French (2004) and Fama & French (1992).
Value-weighted portfolios

High Medium Low Spread

RM-RF (0.922)**
(1.000)**
(1.079)**
(-0.157)**
(0.221)
(0.496)
(0.100)



LMH (0.122)**
(-0.017)
(0.318)**
(-0.196)**
(0.124)
(0.131)
(0.209)
(0.165)




Accessible table text
| — | High | Medium | Low | Spread |
|---|---|---|---|---|
| Intercept | (-0.007) (0.045) | (-0.043)** (0 .050) | (-0.001) (0.143) | (-0.006) (0.051) |
| RM-RF | (0.957)** (0.183) | (1.018)** (0.214) | (0.716)** (0.574) | (0.241)** (0.325) |
| LMH | (-0.021) (0.071) | (0.059)** (0.075) | (0.208)** (0.221) | (-0.229)** (0.065) |
| BMS | (0.071) (0.087) | (0.131)** (0.082) | (-0.134)** (0.158) | (0.063)** (0.045) |
| 𝑹𝟐 | 0.775 | 0.743 | 0.415 | 0.675 |
6.5. Estimated result for when sorted by equal-weighted portfolio (size)
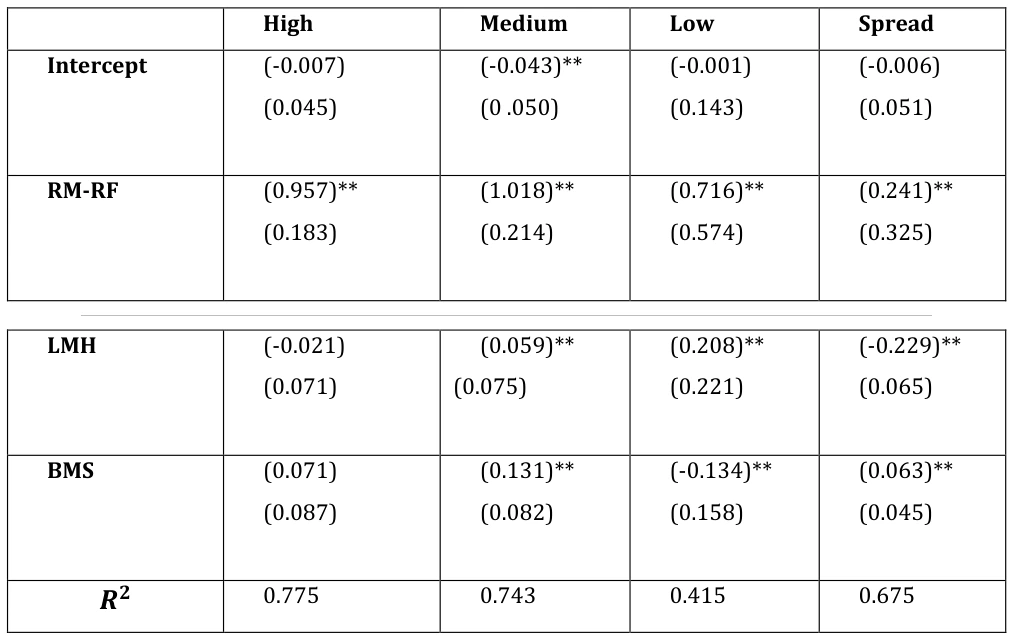
Table 4 estimates the result for risk-adjusted result of portfolios sorted by banks assets mean sorted by banks size if we see in panel (A) Market model: Rit −RFt = αi + βi(RMt −RFt) + ϵit sorted by banks size in three different portfolios there have two variables independent variable is RMt −RFt, and dependent variable is Rit −RFt, the result for intercept first row sorted by banks size in four different portfolios (low, medium, high and spread) show that one value is (medium) portfolio is significant at 5% confidence interval, and higher value between (low, medium and high) is 1.079 which belongs to low portfolio and the lowest value belong to high portfolio that value is 0.922, and r-square value in panel when we observe in panel (A) Market model, in this panel the value RMt −RFt sorted by bank size hare the highest value between (low, medium and high) portfolio belong to low portfolio and that value is 1.079, and the lowest value between (low, medium and high) portfolio is 0.922 that belongs to high portfolio and spread portfolio is difference between low and high portfolio, all value in this row that belong between (low, medium, high and spread) are positive and significant at 5% confidence interval.
- Market model, sorted by bank size, the low portfolio r-square is 0.301, in medium portfolio r-square is 0.651, in high portfolio r-square is 0.758 and in spread portfolio rsquare is 0.362.
Table 4 when we distinguish panel (B) Two-factor model: 𝑅𝑖𝑡 −𝑅𝐹𝑡 = 𝛼𝑖 + 𝛾𝑖𝐿𝑀𝐻𝑡 + 𝛿𝑖𝐵𝑀𝑆𝑡 + 𝜖𝑖𝑡 in two-factor model two variables (LMH, BMS) are independent and one variable 𝑅𝑖𝑡 −𝑅𝐹𝑡 is dependent, when we see LMH in panel (B) Two-factor model, sorted by bank size portfolio, LMH two values (low and high) portfolio are positive and medium portfolio value is negative and between all four values (low, medium, high and spread) portfolio and three values (low, high and spread) portfolio are significant at 5% confidence interval and medium portfolio is insignificant, the highest value between (low, medium and high) portfolio is 0.318 that value belongs to low portfolio and lowest value between (low, medium and high) portfolio belongs to medium portfolio this value is -0.017.
When we observe BMS in panel (B) Two-factor model, sorted by bank size, in BMS between all values (low, medium, high and spread) portfolios two of them are positive and in there three of them values (low, medium and spread) portfolios are significant at 5% confidence interval and the highest value between (low, medium and high) is 0.152 that value belongs to medium portfolio and the lowest value between (low, medium and high) belong to low portfolio that value is -0.182.
The r-square value in panel (B) Two-factor model, sorted by equal-weighted portfolio is low portfolio r-square is 0.314, the medium portfolio r-square value is 0.100, the high portfolio r-square value is 0.088 and the spread portfolio value is 0.231.
When we distinguish Table 4 estimates the result for risk-adjusted result of portfolios sorted on equal-weighted portfolio, in the panel (C) Three-factor model: 𝑅𝑖𝑡 −𝑅𝐹𝑡 = 𝛼𝑖 + 𝛽𝑖(𝑅𝑀𝑡 −𝑅𝐹𝑡) + 𝛾𝑖𝐿𝑀𝐻𝑡 + 𝛿𝑖𝐵𝑀𝑆𝑡 + 𝜖𝑖𝑡 in three-factor model have three variables independent (𝑅𝑀𝑡 −𝑅𝐹𝑡, LMH and BMS) and dependent variable is one that is (𝑅𝑖𝑡 −𝑅𝐹𝑡), the first variable RM-FM there in all four values (low, medium, high and spread) portfolios are positive and the highest value of them is 1.018 and this value belongs to medium portfolio and the lowest value belong to low portfolio that value is 0.716, all four values (low, medium, high and spread) portfolio are significant at 5% confidence interval.
When we talk about LMH and BMS, between them LMH has a negative effect on return if we arrange banks by size then got LMH, and BMS has a positive effect here.
In panel (C) Three-factor model, r-square values in low portfolio is 0.415, in medium portfolio r-square is 0.743, in high portfolio r-square is 0.775 and in spread portfolio rsquare is 0.675.
In one-factor, two-factor and three-factor models when we see 𝑅𝑖𝑡 −𝑅𝐹𝑡 values in equal-weighted portfolios than we know that 𝑅𝑖𝑡 −𝑅𝐹𝑡 highest value belongs low portfolio and lowest value belongs in high portfolio its mean 𝑅𝑖𝑡 −𝑅𝐹𝑡 or expected returns have a negative effect on market-value capital and size of banks have positive effect on the relationship between market-value capital ratios and bank stock returns.
6.5.1. Market-value capital ratios and bank profitability
In this section, we find what impact market-value capital ratios on bank profitability. There we take every bank profit than check that market-value capital ratios have what relationship on profit.
6.5.2. Returns on assets when MLR change
We there take 14 years of previous data from 2005 to 2018 and check the impact of market-value capital ratios on bank profitability after analysis of the data we show our result in fig 1 and the table below.
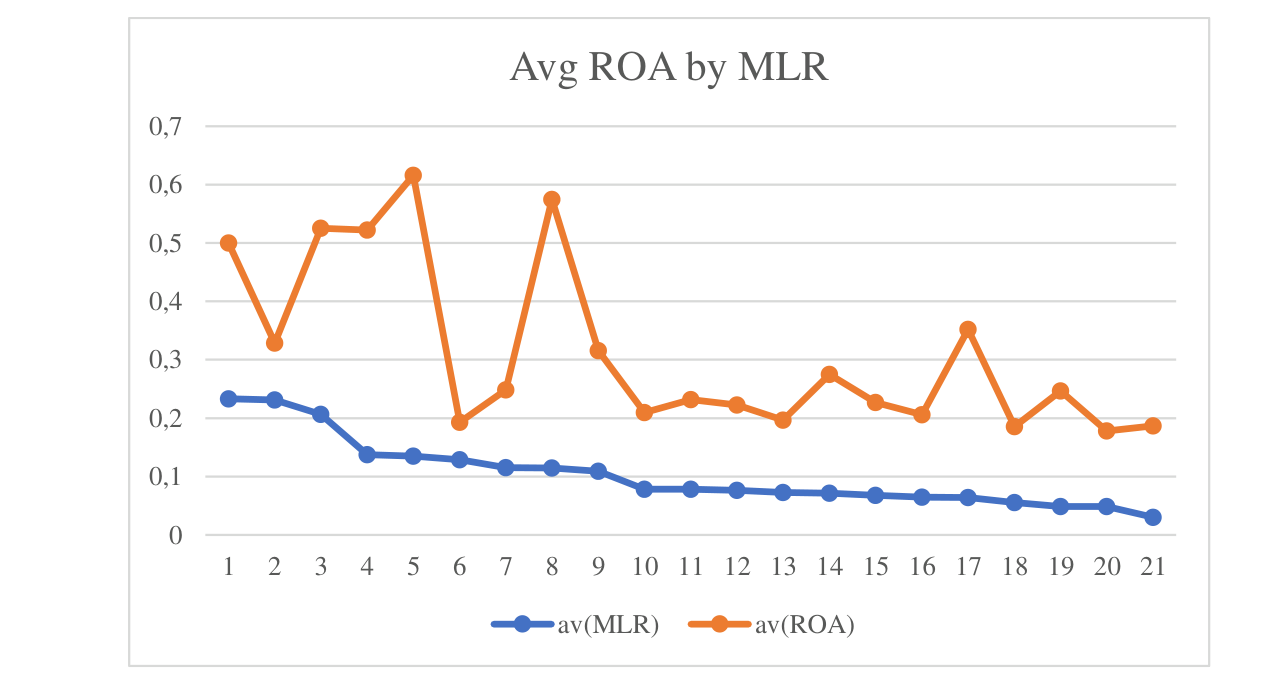
When we see fig 1 have three portfolio average returns on assets first is high average banks portfolio second is medium average portfolio and third is low average banks portfolio, in this fig 1 we took 21 Pakistani listed banks average assets returns ( average assets returns we took by current year subtract in previous year then divided by previous year value ) than arrange them in portfolio (high, medium and low), in top banks have assets returns higher than medium and lower banks, when we see first 7 banks have average returns in years (2005 to 2018) are positive and above than 3.00 and when we observe average market-value capital ratios in year have also positive but values between 1.00 to 2.00, similarly when we see medium 7 banks average assets returns lower than higher banks it average 2.00 and market-value capital ratios it average around 1.00 and third low portfolio average assets returns is around 1.00 and average market-value capital ratios below than 1.00. Our results show that higher the average market-value capital ratios have higher average asset returns mean higher profitability than those banks which have lower market-value capital ratios.
Fama & French (1995) and Chen (2001) also shows a positive relation between marketvalue capital ratios and bank profitability.
6.5.3. Performance of banks and the relationship between market-value capital ratios
on bank stock return in financial crisis years.
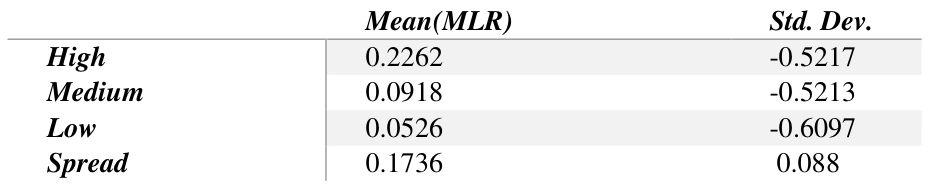
In 2008 was the year in which the whole world was in crisis, so we took data about market-value capital ratios and stock returns in the year 2008 to check the relationship between market-value capital ratios on bank stock return in financial crisis.
Accessible table text
| — | — | — | — | Mean(MLR) | — | — | Std. Dev. | — |
|---|---|---|---|---|---|---|---|---|
| — | High | — | — | 0.2262 | — | — | -0.5217 | — |
| — | Medium | — | 0.0918 -0.5213 | — | — | — | — | — |
| — | Low | — | — | 0.0526 | — | — | -0.6097 | — |
| — | Spread | — | 0.1736 0.088 | — | — | — | — | — |
We took average data from all three portfolios in year 2008 than we check the relationship between market-value capital ratios on bank stock return after we analysis than we know that there is positive check the relationship between market-value capital ratios on bank stock return in financial crisis because when we check our results that average market-value capital in high portfolio than stock returns also higher than those banks which have lover market-value capital ratios.
In the second session, we check the relationship between market-value capital ratios on banks' profitability in the financial crisis years from 2007 to 2009.
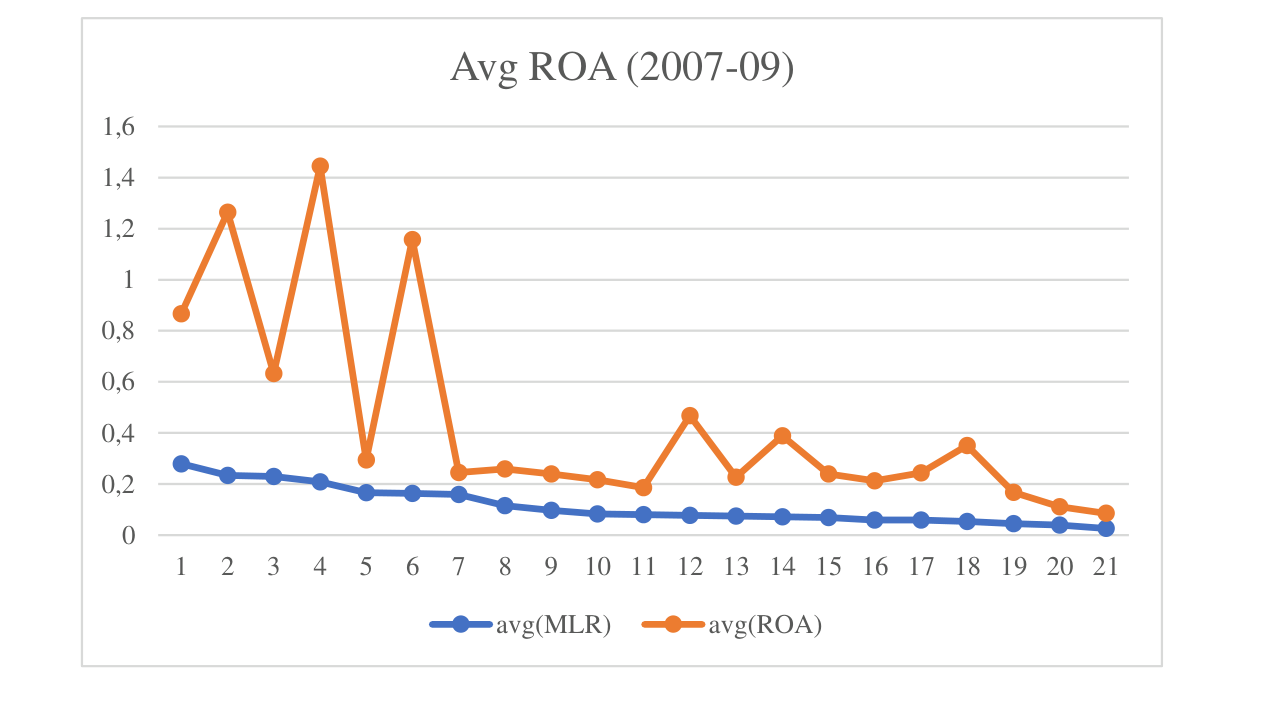
After we analyse the data our results show in fig 2 have three portfolio average returns on assets first is high average banks portfolio second is medium average portfolio and third is low average banks portfolio, in this fig 1 we took 21 Pakistani listed banks average assets returns (average assets returns we took by current year subtract in previous year then divided by previous year value ) than arrange them in portfolio (high, medium and low), in top banks have assets returns higher than medium and lower banks, when we see first 7 banks have average returns in years (2007 to 2009) have higher average asset return than medium and low market-value capital ratios which around 1.20 and in medium portfolio banks have average bank returns lower than both high and low portfolios that average value is around 0.20 and in low portfolio average returns in banks higher than medium banks but lower than high portfolio banks which is above than 0.20. overall average bank returns lower than normal years.
7. Discussion
When we disuse our first hypotheses that related the impact of market-value capital ratios on banks stock return, banks with higher market-valued capital ratios have on average lower subsequent stock returns than` banks with lower market-valued capital ratios. After we estimated the result about our data that related on Pakistani banking sector from 2005 to 2018 than I know that same as previous studies Chen (2011) and Blanco (2012). Our results shows that market-value capital ratios have negative impact on banks stock returns. In other words, there have a negative relationship between market-value capital ratios and banks stock returns when banks have market-value capital ratios high than these banks stock returns lower than those banks that have low market-value capital ratios.
Chen (2011) suggests that the market-value capital proportion as a marker gauge the risk of banks. Specifically, Chen inspects the cross-sectional association between the business sector esteemed capital ratios (MLR) and stock returns of recorded Japanese banks. It is found that preserve money with lower business sector esteemed capital proportions (MLR) has had lower profits for normal than manages an account with higher business esteemed capital proportions (MLR). On the other hand, they demonstrate that this positive relationship between market-value capital proportion (MLR) and bank stock returns could be recognized to contrast in a presentation to risk variables. The business esteemed capital proportion (MLR) seems to an intermediary for affectability to basic risk calculates bank stock returns. They additionally relate the cross-sectional variety in business sector esteemed capital proportions (MLR) to logical examples in relative gainfulness by demonstrating that low market-esteemed capital proportion flags industriously low productivity.
When we saw our second hypotheses related in our study in which we explain that due to rational pricing model if have relation between market-value capital ratios and average returns than on average returns have risk factor with market-value capital ratios. The market-valued capital ratios are proxies for sensitivity to risk factors that capture the cross-sectional variation in bank stock returns. If we say in easy worlds than if banks have high future returns it's mean these banks must have market-value capital ratios also high. When banks have market-value capital ratios low than these banks have future returns low. After estimating the results than we know that same as previous studies Chen (2011), the market-valued capital ratios are proxies for sensitivity to risk factors that capture the cross-sectional variation in bank stock returns.
Rossi (2012) explain the three-factor model demonstrate that the beta alone can't clarify the risk returns connection. The outcomes found are like those of Fama & French (1998), and Cavaliere and Costa (1999). Rossi paper the reverse connection in the focus of beta and size is confirmed. The estimations of "lambda" coefficients are accurately not quite the same as zero and it diminishes when the size expands: the outcomes display a sideimpact. The after-effects of Rossi's study emphasize that the variable size joined by the beta appears to have a more important instructive force. The beta, all factually critical, does not reduce with expanding the size, but rather unexpectedly builds, and does not appear to take after specific examples to expand the book-to-market esteem. The estimations of the "lambda" coefficient are quite often measurably noteworthy and diminish with expanding the size, demonstrating a higher risk premium for less secure resources as anticipated by the CAPM. In such circumstances, even the portfolio returns, with a few exemptions, decline, and this does not permit dismissing the speculation of a connection in the middle of execution and size.
When we distinguish the third hypotheses related to profit, market-value capital ratios have an impact on bank efficiency or not? Banks with higher market-valued capital ratios are persistently more profitable than banks with lower market-valued capital ratios, which means there has a positive relationship between market-value capital ratios and profit.
We get the same result as previous studies Chen (2011) and Rossi (2012) the relationship between market-value capital ratios and bank efficiency have positive mean when market-value capital ratios high than bank efficiency also high and when banks have market-value capital ratios low than banks also have low profit.
Blanco (2012) explain the CAPM exact disappointment, going to the Fama & French Three-Factor Model. Blanco has contemplated the American market, from July 1926 to January 2006, the investigational conduct identified with the two traditional models in the financial writing, the CAPM and the Fama & French Three-Factor Model (1992). The outcomes got to demonstrate a faithful proof for Fama & French Three-Factor Model, appreciation to the CAPM. Blanco can say that for the example period and the business sector broke down, there exist a proof of how the qualities identified with the size and the BE/ME proportion, clarify the benefits returns. Anyway, these outcomes are because of the way the portfolios are shaped.
When we differentiate our four hypotheses that is related on banks size does have any effect on the relationship between market-value capital ratios and banks stock returns. The results examine that the banks with higher assets size they have strong positive effect on the relationship between market-value capital ratios and banks stock returns than those banks which have lower asset size. In second session our fifth hypothesis we check the relationship between market-value capital ratios on banks profitability in financial crisis years from 2007 to 2009. The result shows that in financial crisis bank with higher market-value capital ratios have higher stock returns than bank with lower market-value capital ratios but have lower bank stock returns in normal years. When we talk about profitability in financial crisis higher bank in market-value capital ratios have higher assets returns than medium and low portfolios and medium portfolio have lowest bank asset returns. Furthermore, outcomes show that the banks perform differently during financial crisis because banks with higher have higher asset returns than those banks which have lower market-value capital ratios in normally. But during financial crisis, high portfolio banks have high asset returns but other two portfolios (medium and low) they perform different medium banks have lower profitability than low portfolio. There is a positive relationship between market-value capital ratios on bank stock return in the financial crisis year 2008.
Conclusion
The experimental examination explores the cross-sectional relationship between the market-value capital ratios and stock returns on recorded Pakistani banks from 2005 to 2018. The outcomes from both portfolios sorting by value-weighted and equal-weighted relapses boost the theory that the capital ratios (MLR) are defiantly linked with normal returns. The estimated results examine a negative relationship between the Pakistan banks stock returns and market-value capital ratios is undoubted because of a more key relationship in the focus on risk and return in the asset pricing model, there must be regular risk calculates returns related with the market-value capital ratios (MLR).
Furthermore, we also observe average returns of bank portfolios sorted on the marketvalue capital ratios (MLR) and the variable loadings on the presentation to risk components. Findings confirm that the market-value capital ratios in fact intermediaries for affectability to risk deliberately that catch normal change in returns. However, the negative relationship between average returns and the market-value capital ratios could be recognized to contrast in arrangement to risk.
Furthermore, we explain the cross-sectional combination in the market-value capital ratios to systematic examples in relative gainfulness by indicating that low marketesteemed capital proportion streamer resolutely low benefit, while higher the marketvalue capital ratios are related with determinedly higher productivity. The estimated result show that relationship between market-value capital ratios and banks stock returns have a negative relation. Moreover, large bank size has positive effect on productivity. Additionally, the estimated results about market-value capital ratios, banks stock returns, bank efficiency and future returns, then stock returns has a negative influence on marketvalue capital ratios. However, the bank efficiency have a positive impact on the marketvalue capital ratios.
Limitations
Area of the study in this research paper is related about stocks returns of banks, future returns, and profitability, and we investigate market-value capital ratios does have any effect on banks stock returns, future returns, and profitability, and the banks size effect on the relationship of banks stock return and market capital ratios. In this study our focus on banks and the stock market, and this paper helpful for those students who want to choose the major area about finance and economics. If we talk about how much this paper is helpful for us then we can explain it like that, this paper investigates about Pakistani listed banks main four things those are helpful to know the performance, stock returns, future returns of banks and the banks size effect because we explain in this paper that banks in Pakistan with lower market capital ratios have had higher average stock returns of banks than banks with higher market capital ratios, which mean there is negative relationship between market-value capital ratios (MLR) and banks stock returns (SR). we also investigate there is a negative relationship between market-value capital ratios (MLR) and future returns based on rational pricing model and also clarify that the relationship between market-value capital ratios (MLR) and bank efficiency, after examining the cross-section relationship between market-value capital ratios and profit on Pakistani listed banks, we show that there is the positive relationship between marketvalue capital ratios (MLR) and bank efficiency and banks size also have positive effect on the relationship between market-value capital ratios and banks stock returns. These results give us information about Pakistani banks stock returns and performance, this paper helpful for investors to give them suggestion that which bank have on top about profit, future returns and stock returns and they invest in that bank.
Further research
In this study, we have chosen area just about banks stocks returns for Pakistani banks from the year 2005 to 2018 but we will also use these methods on the companies to describe the market value capital ratios have what Impacts on stock returns, and for the further study will choose other different countries and chose different years to check that on other countries market-capital ratios have the same effect on stock returns, future return, and profitability. In this study we used three models to investigate the between market value capital ratios have what impact on bank stock return, on future returns and efficiency furthermore other will use Fama & French five factors model to check the capital ratios have what impact on stock return, on future returns, on efficiency and book to market ratios, furthermore, to use these methods will check the growth of banks and companies.
List of Abbreviations
CAPM Asset pricing model or one-factor model DCF Three-factor model BV/MV Book to market-value BE/ME Book to market ratios MLR Market-value capital ratios SR Stock returns NYSE New York stock returns CRSC Center for research in security costs AMEX American stock exchange CRSP Center for research in security price SIC Standard industrial classification E-U 15 15 European countries LMH Low portfolio values subtracted high portfolio value sorted by asset BMS High portfolio values subtracted low portfolio value sorted by MLR